Visualizing high level data on nature based Carbon Credit Projects
Sourcing and Charting a handful of Nature based Carbon Credit Projects
As of late, I’ve been interested in understanding nature based carbon credit projects. For brevity I won’t give too much background on the carbon credit markets. My short summary is that these projects are effectively conservation and/or restoration projects implemented across the world with the aim of pulling CO2 out of the atmosphere and preserving local eco-systems. The projects, if verified, can then “claim and sell” carbon credits in the voluntary carbon credit markets. These are unregulated markets where a companies (like Apple) pays project developers to ‘offset’ their own carbon emissions.
I was particularly interested in projects focused on Mangroves and Seagrasses given their relative newness to the market. There is a lot more projects focused on Terrestrial Forrests, but this was less of my focus as they have been around for many years.. I did throw in the Rimba Ray Projects in Indonesia, which was mostly terrestrial forrest, but also has elements of mangrove conservation in it.
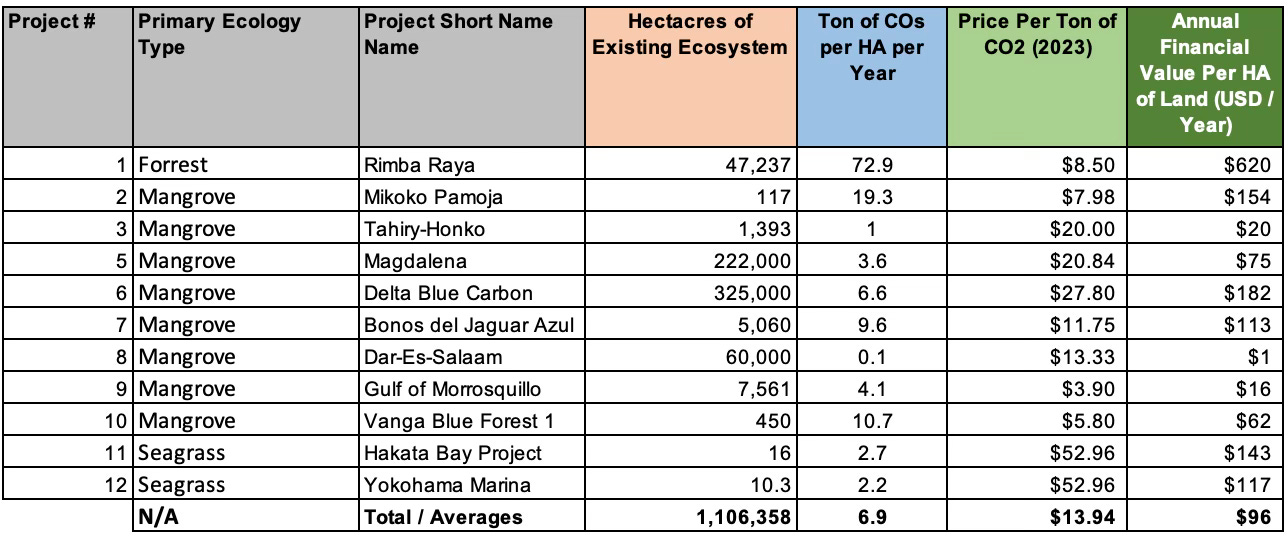
The primary sources on these projects are from either Verra or Plan Vivo. These are carbon verification organization that help to ensure natured based projects are valid and verified. These sites have portals that allow you to read about each project they verified. In a few cases I gather CO2 prices from published news articles. The CO2 prices were the hardest piece of information to source . I did deep research on 36 total projects, however I was only able to fill in all the columns of data on 12 projects.
Summary Data Table of Key Metrics
If you’re inclined to just read data tables here is a snapshot of the high-level metrics.
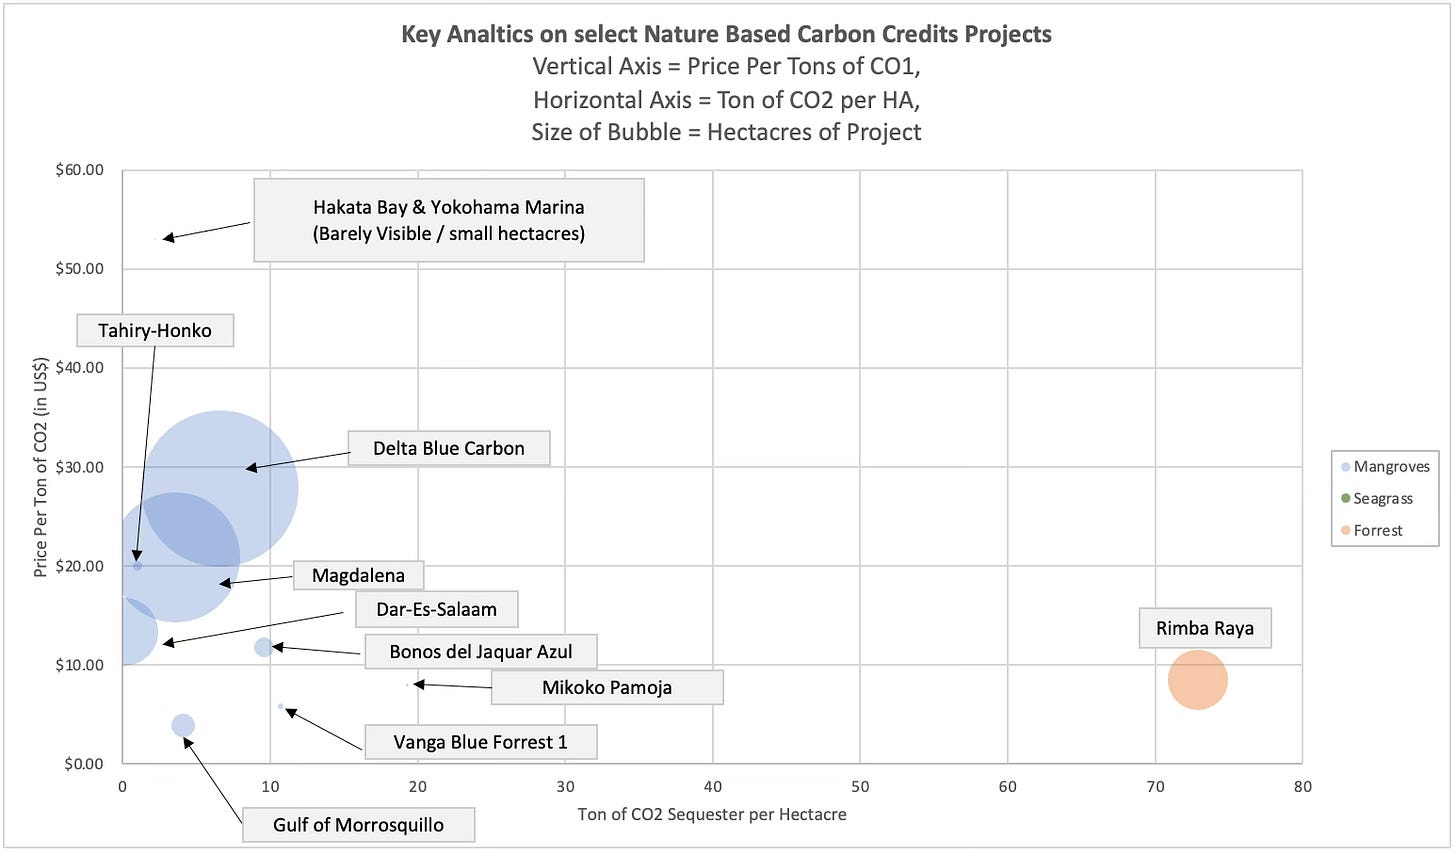
Scatterplot of the same data
If you’re like me you want to visualize the data table. This scatter plot below shows the same data minus the final column of Annual Financial Value per HA.
Seagrass Insights
It’s probably worth mentioning that there were relatively few Seagrass projects from which to pull. This is likely because the methodologies to measure seagrasses are relatively new. As a result, there are few seagrass projects. The chart above shows the seagrasses (barely). If you squint hard in the upper left corner you’ll see them. The reason they are so small is due to the very small size in hectares. Interestingly, the prices on these two seagrass projects are among the highest I recorded. This could be because the projects are based in Japan. Japan seems to have a relatively well developed market for CO2 credits. While I’m no expert, I would guess that Japan has done a bit more than the average country to create a national market for CO2 credits resulting in overall higher prices.
Mangrove Insights
It’s interesting to see the range of Prices on Mangroves CO2 per ton, anywhere from $3.90 to $27.80. This shows the high variability on each project. This is probably not a surprise to a wetland scientist, but was news to me. The variability is probably due to many factors including the type of projects, the geographies, the species of mangroves, whether it is a restoration or a conservation project, etc.
Rimba Raya Insights
For reference, I threw in the Rimba Raya project. It is a large project in Indonesia that has a lot of positive press (with good reason). It protects key forrest where the endangered Orangutan resides. It is also an extremely biodiverse tropical rain forrest. So probably not comparable to the other mangrove projects. The obvious uniqueness of the project may be the result for the unusual metrics, making it an outlier for multiple reasons. Future posts may need to expand the sourcing on other the terrestrial projects, and do analysis exploring the uniqueness of this project. Based on reading up on Rimba Raya, I would guess the project is unique based on the qualitative aspects (orangutan territory) as well as the size of the project (in hectares), and the the amount of CO2 sequestered per HA. This last variable is likely caused by the fact that the project is considered "avoided deforestation”, which inherently are able to claim larger amounts of CO2. However, the price of the project is likely not an outlier at $8.50.
Value Per Hectacres
Looking at the financial value per Hectacres provides an interesting high level summary of the ‘value’ of the land for CO2 Credits only. Of course this land has value over and above its ability to generate CO2 credits (such values resides in many areas including biodiversity, fishing, erosion protection, etc.). The range of value per HA are from $1 to $182. Of course, Rimba Raya has an outlier value of $620, due to its uniqueness.
Summary and a few Ideas
The primary purpose of this data investigation was to learn about wetlands and mangroves projects. It provides an interestingly large range of prices, roughly between $4 and $28. There also is a wide range of CO2 tons per HA (from .1 to 20). There’s also a wide range sizes, from 10 to 325,000.
As a future idea, I can see expanding this information and building out a software tool that essentially stores and organizes this information. I could imagine this information helping project developers, NGO, and even private investors in analyzing the economics of nature based Carbon Credit projects. To make this idea scalable, I would think that the verification companies like Verra and Plan Vivo would have to make the information more accessible, ideally via APIs, either that or lots of research. As it stands now, the information is buried in PDFs that require extensive reading and searching to find.
Let me know what you think.


