
Climate scenarios using C-ROADS
Playing with C-ROADS [Climate Rapid Overview and Decision Support] to learn about potential climate scenarios.

I’ve been reading “Doughnut Economics: 7 Ways to Think like a 21st Century Economist” by Kate Raworth. It’s a fantastic read (worthy of a separate post). In the fourth chapter Raworth discusses “C-ROADS”.
C-ROADS stands for Climate Rapid Overview and Decision Support. As their website says, this tool is a “computer simulator that helps people understand the long-term climate impacts of national and regional greenhouse gas emissions reductions at the global level”
I must say the tool was very interesting. I could see spending hours playing with it. However, here are the first few scenarios I ran, and what I learned.
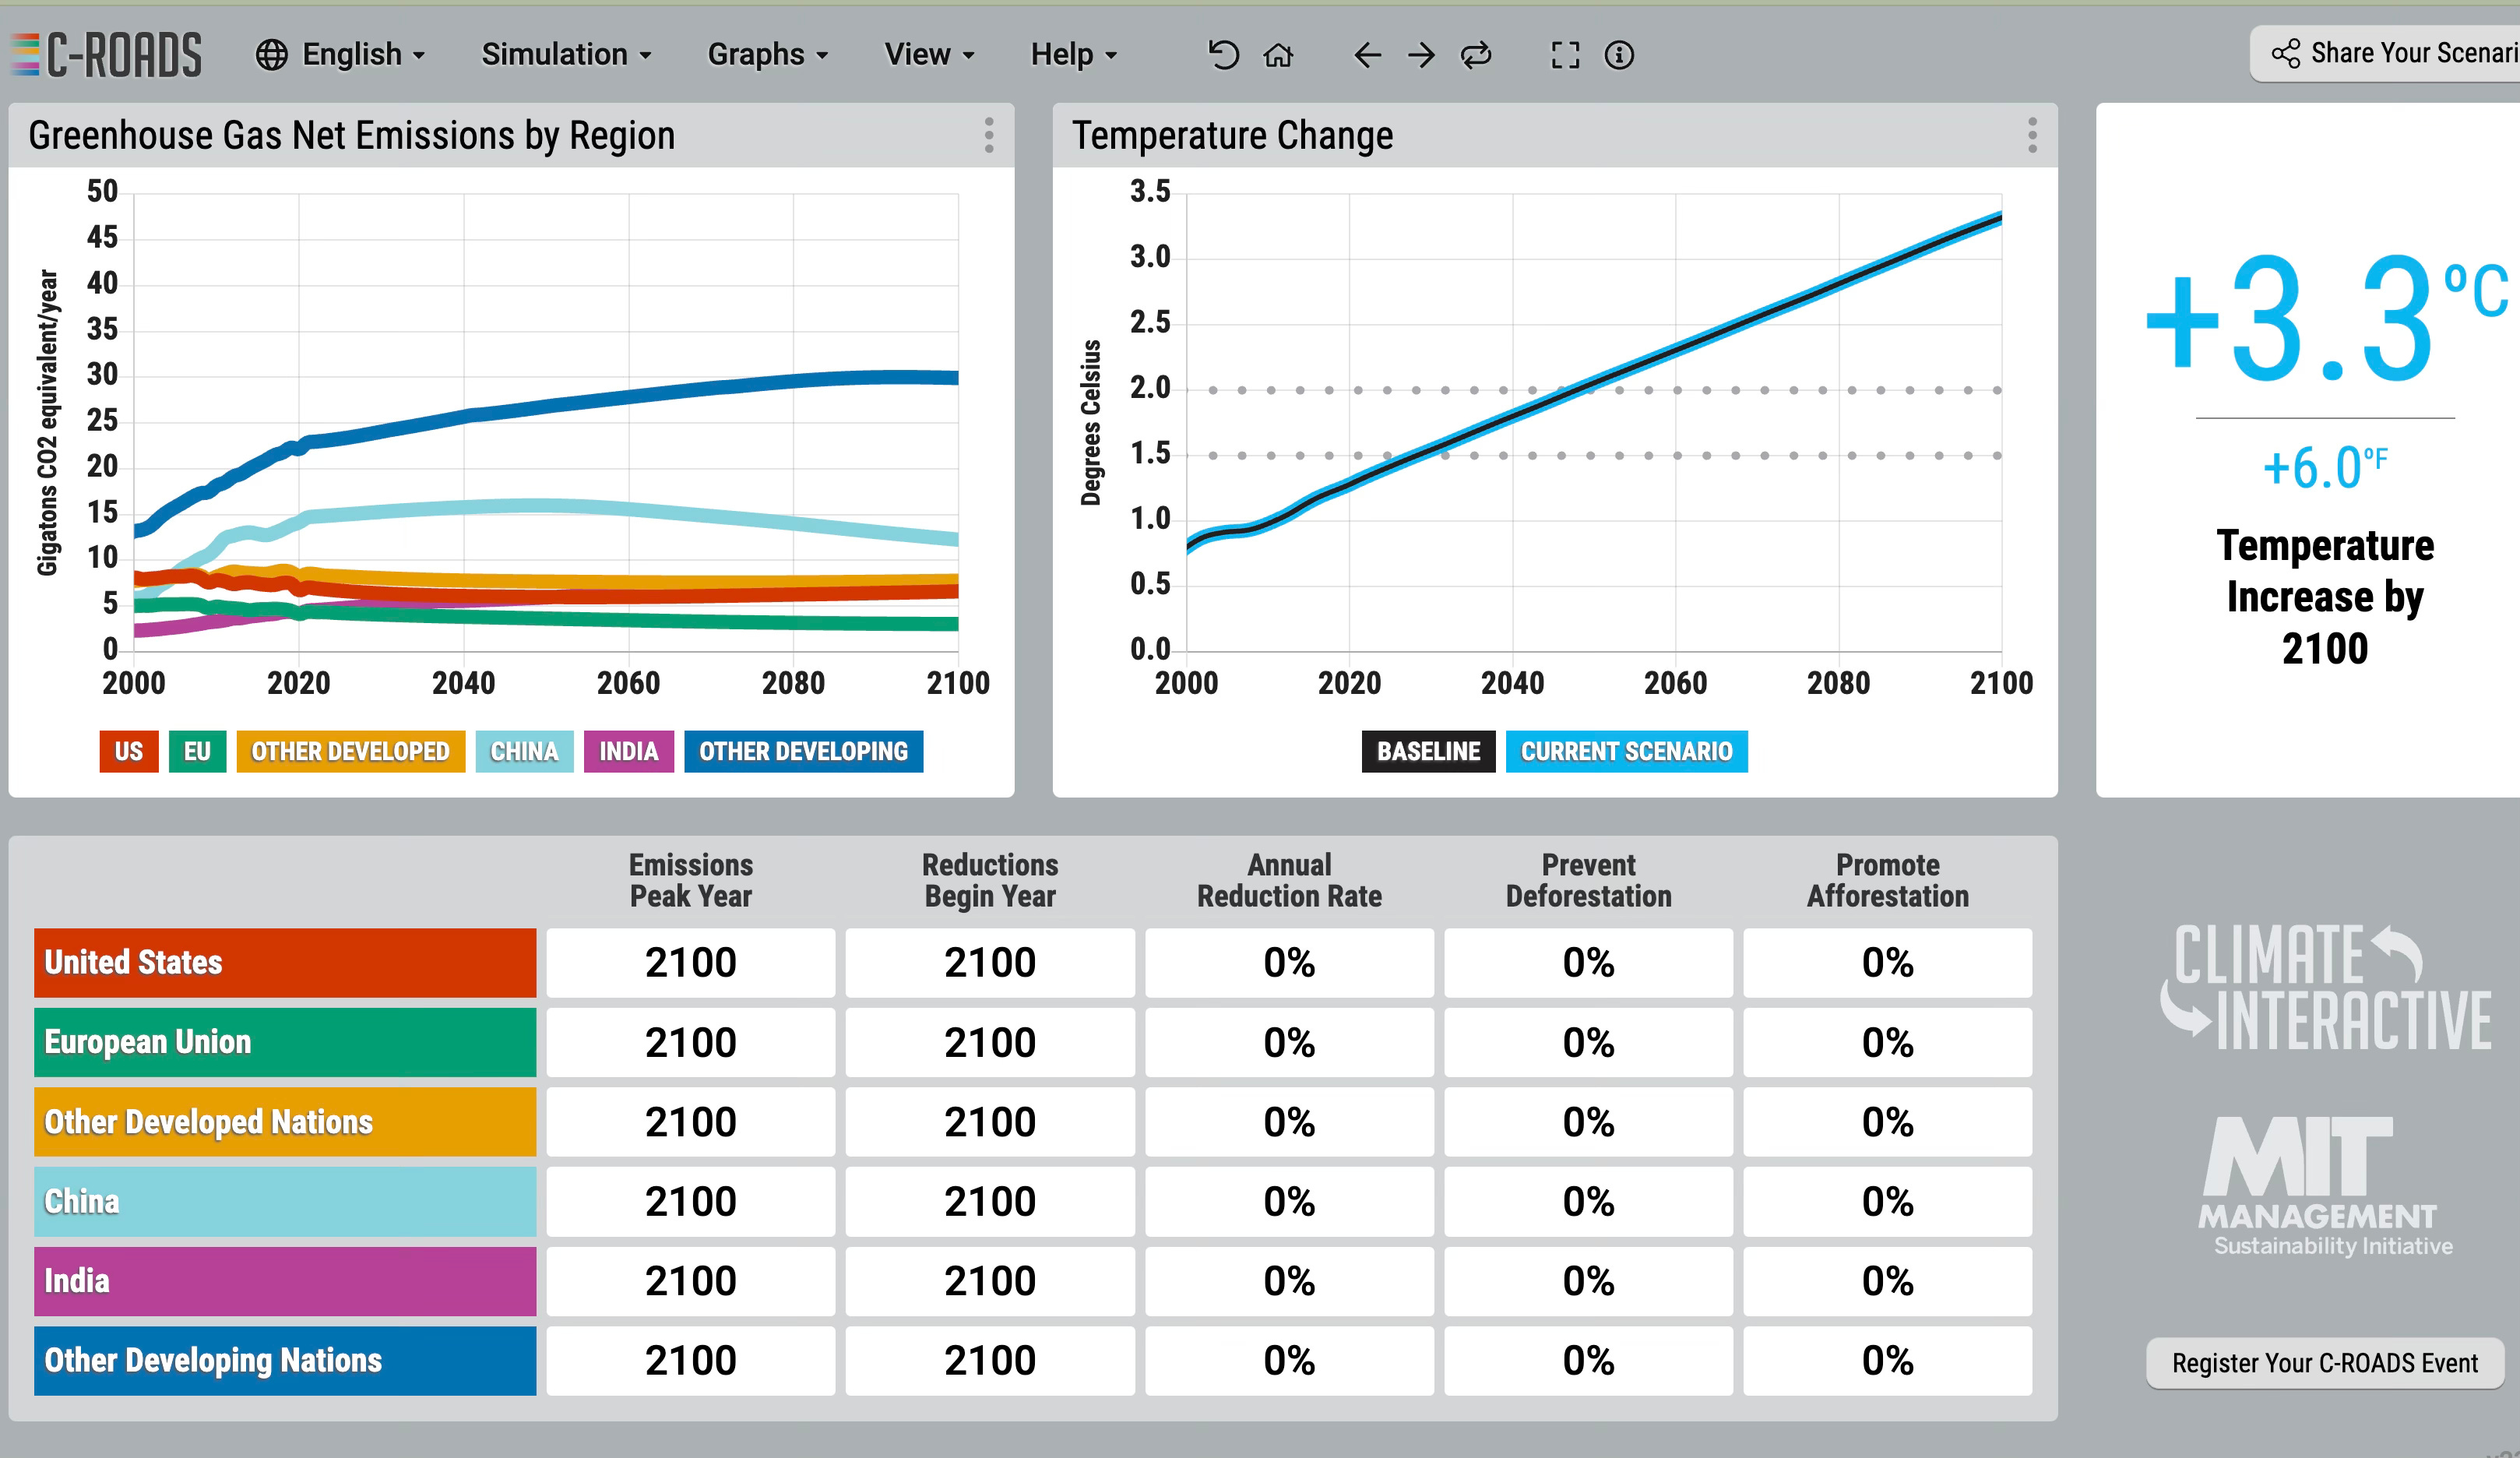
Scenario 0 - The Baseline.
The tool defaults to this, with a notably depressing 3.3 degree (Celsius) rise in Temperature by 2100. Safe to say this is climate crisis in full effect and assumes the status quo.
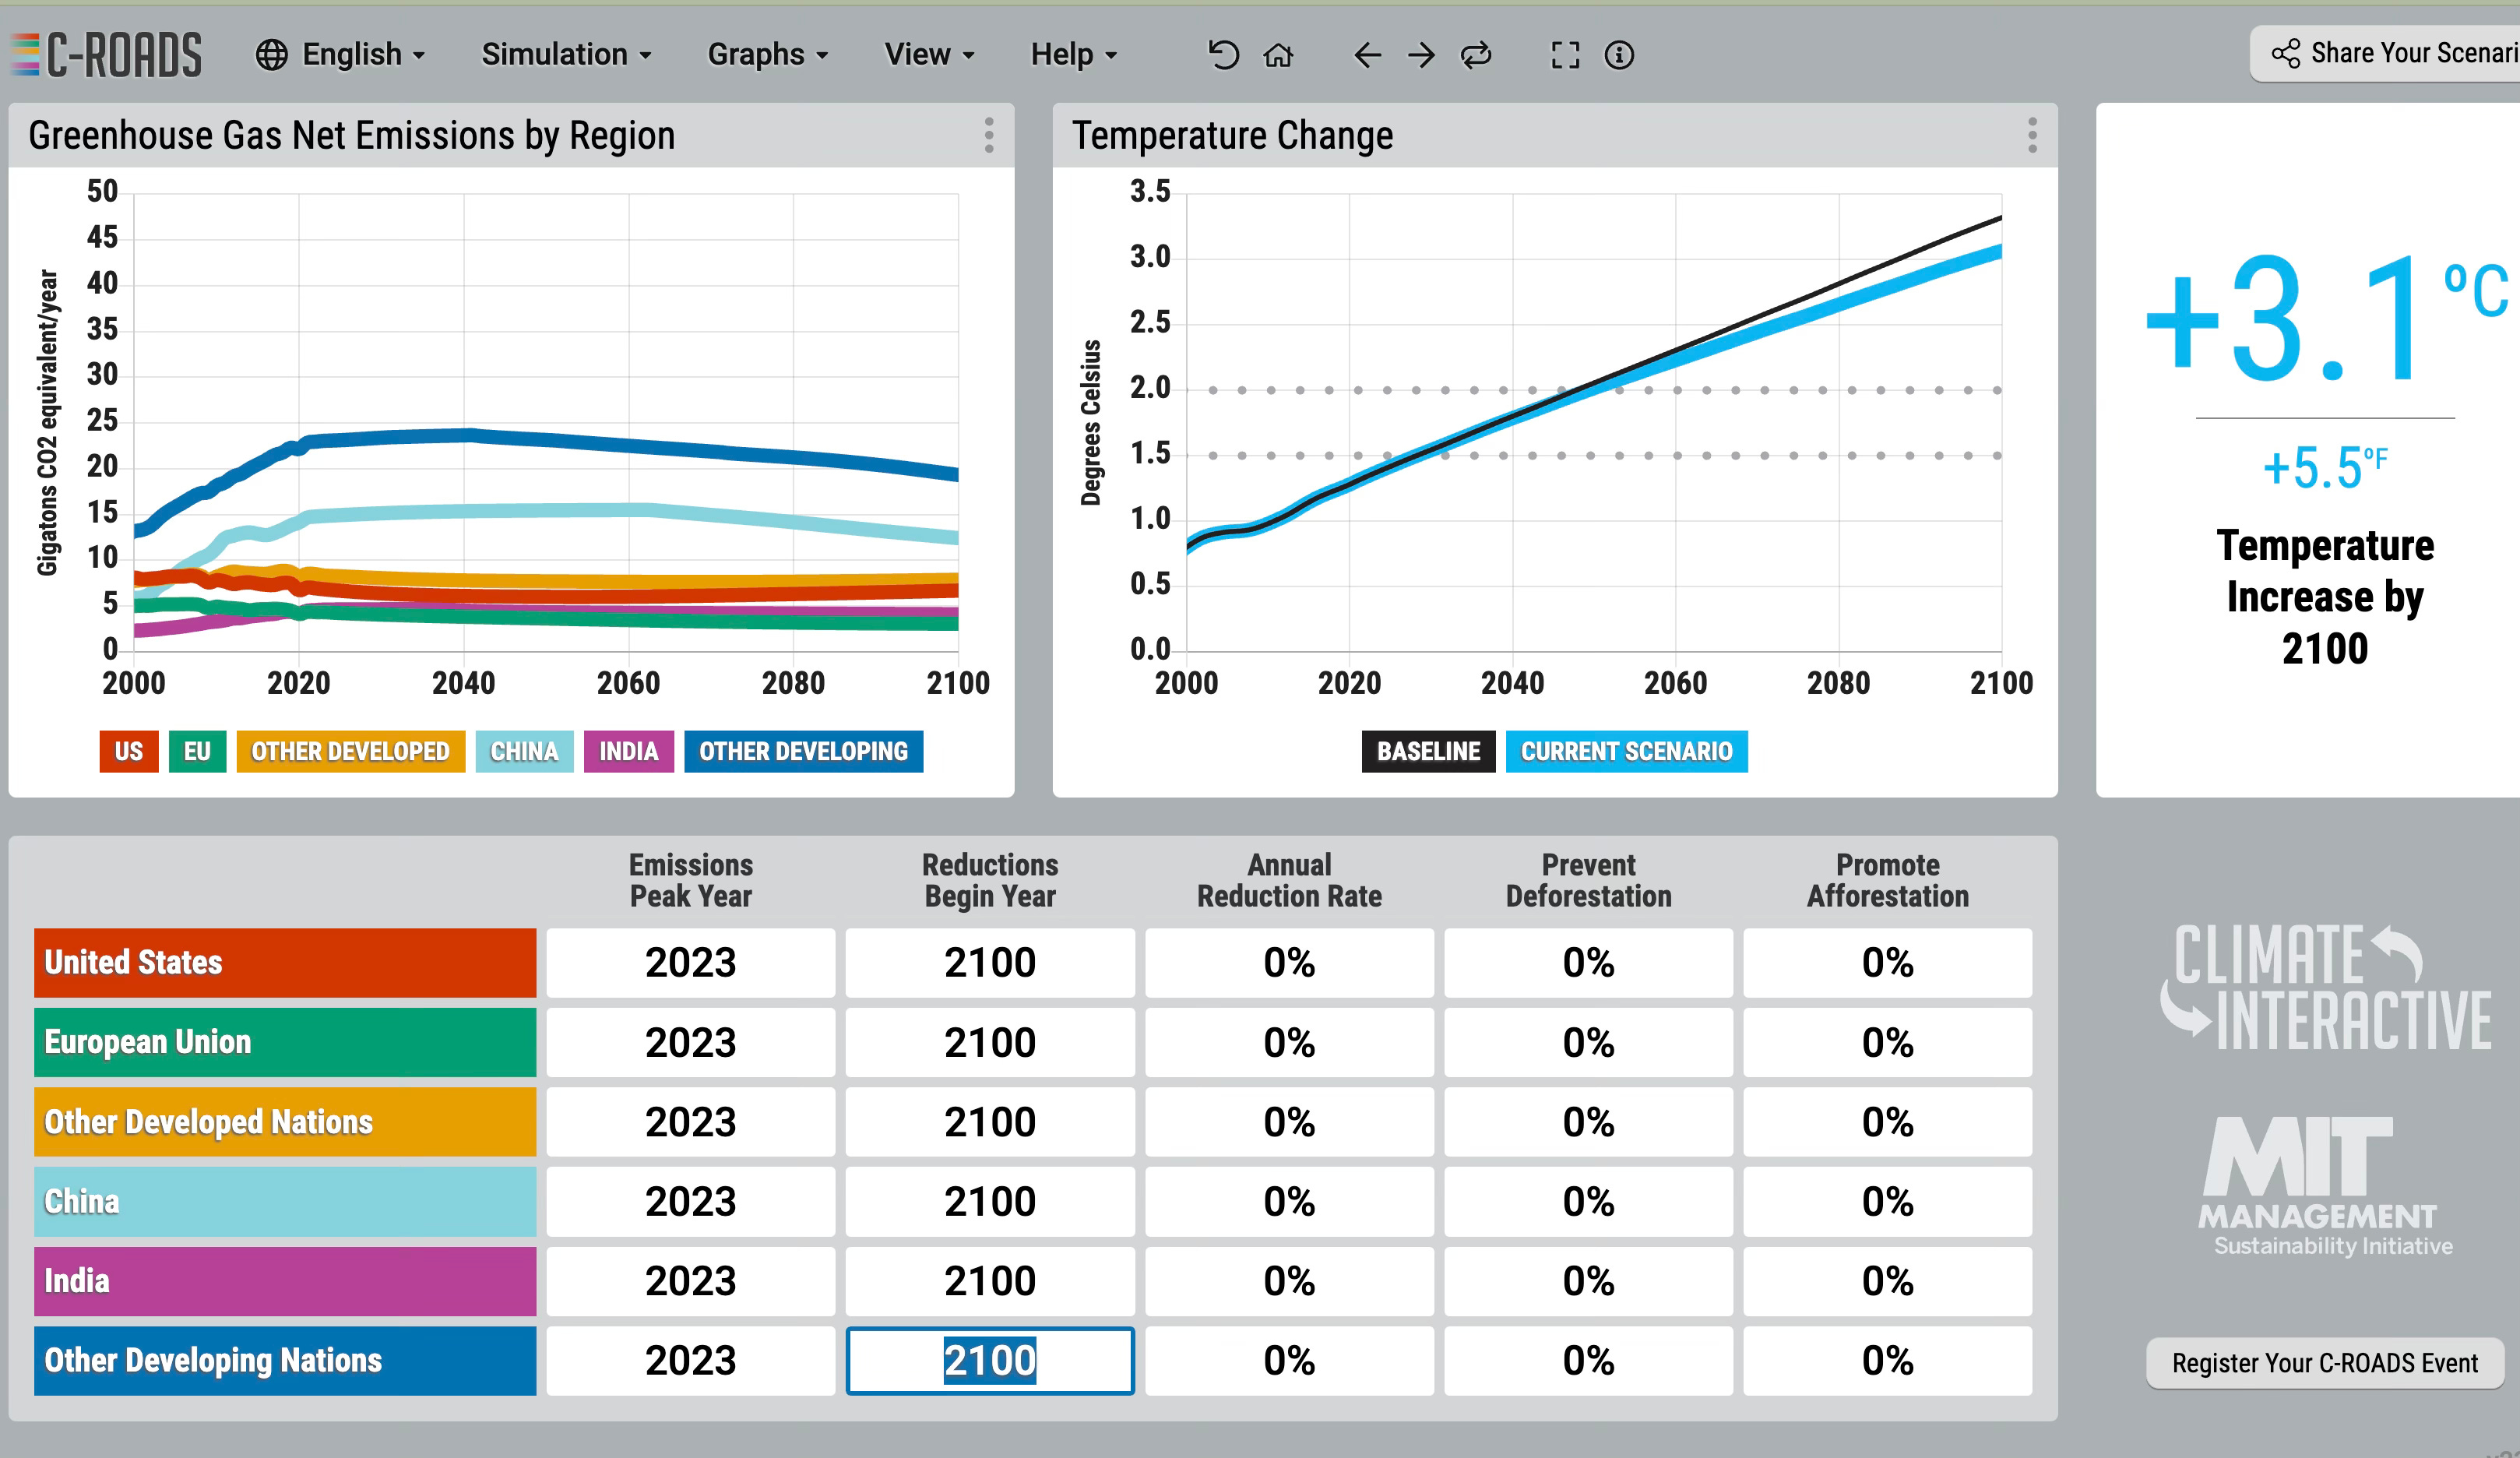
Scenario 1 - Emissions Peak Immediate Peak this Year
The natural first step if we could waver a magic wand globally. Let’s see the effect if we “Stop the Increase” in emission immediately. Yes this a bit of a “best case” scenario, but that is the point of this tool to play with what ifs. The result, a 3.1 degree (Celsius) rise. Translation, we’re still in trouble.
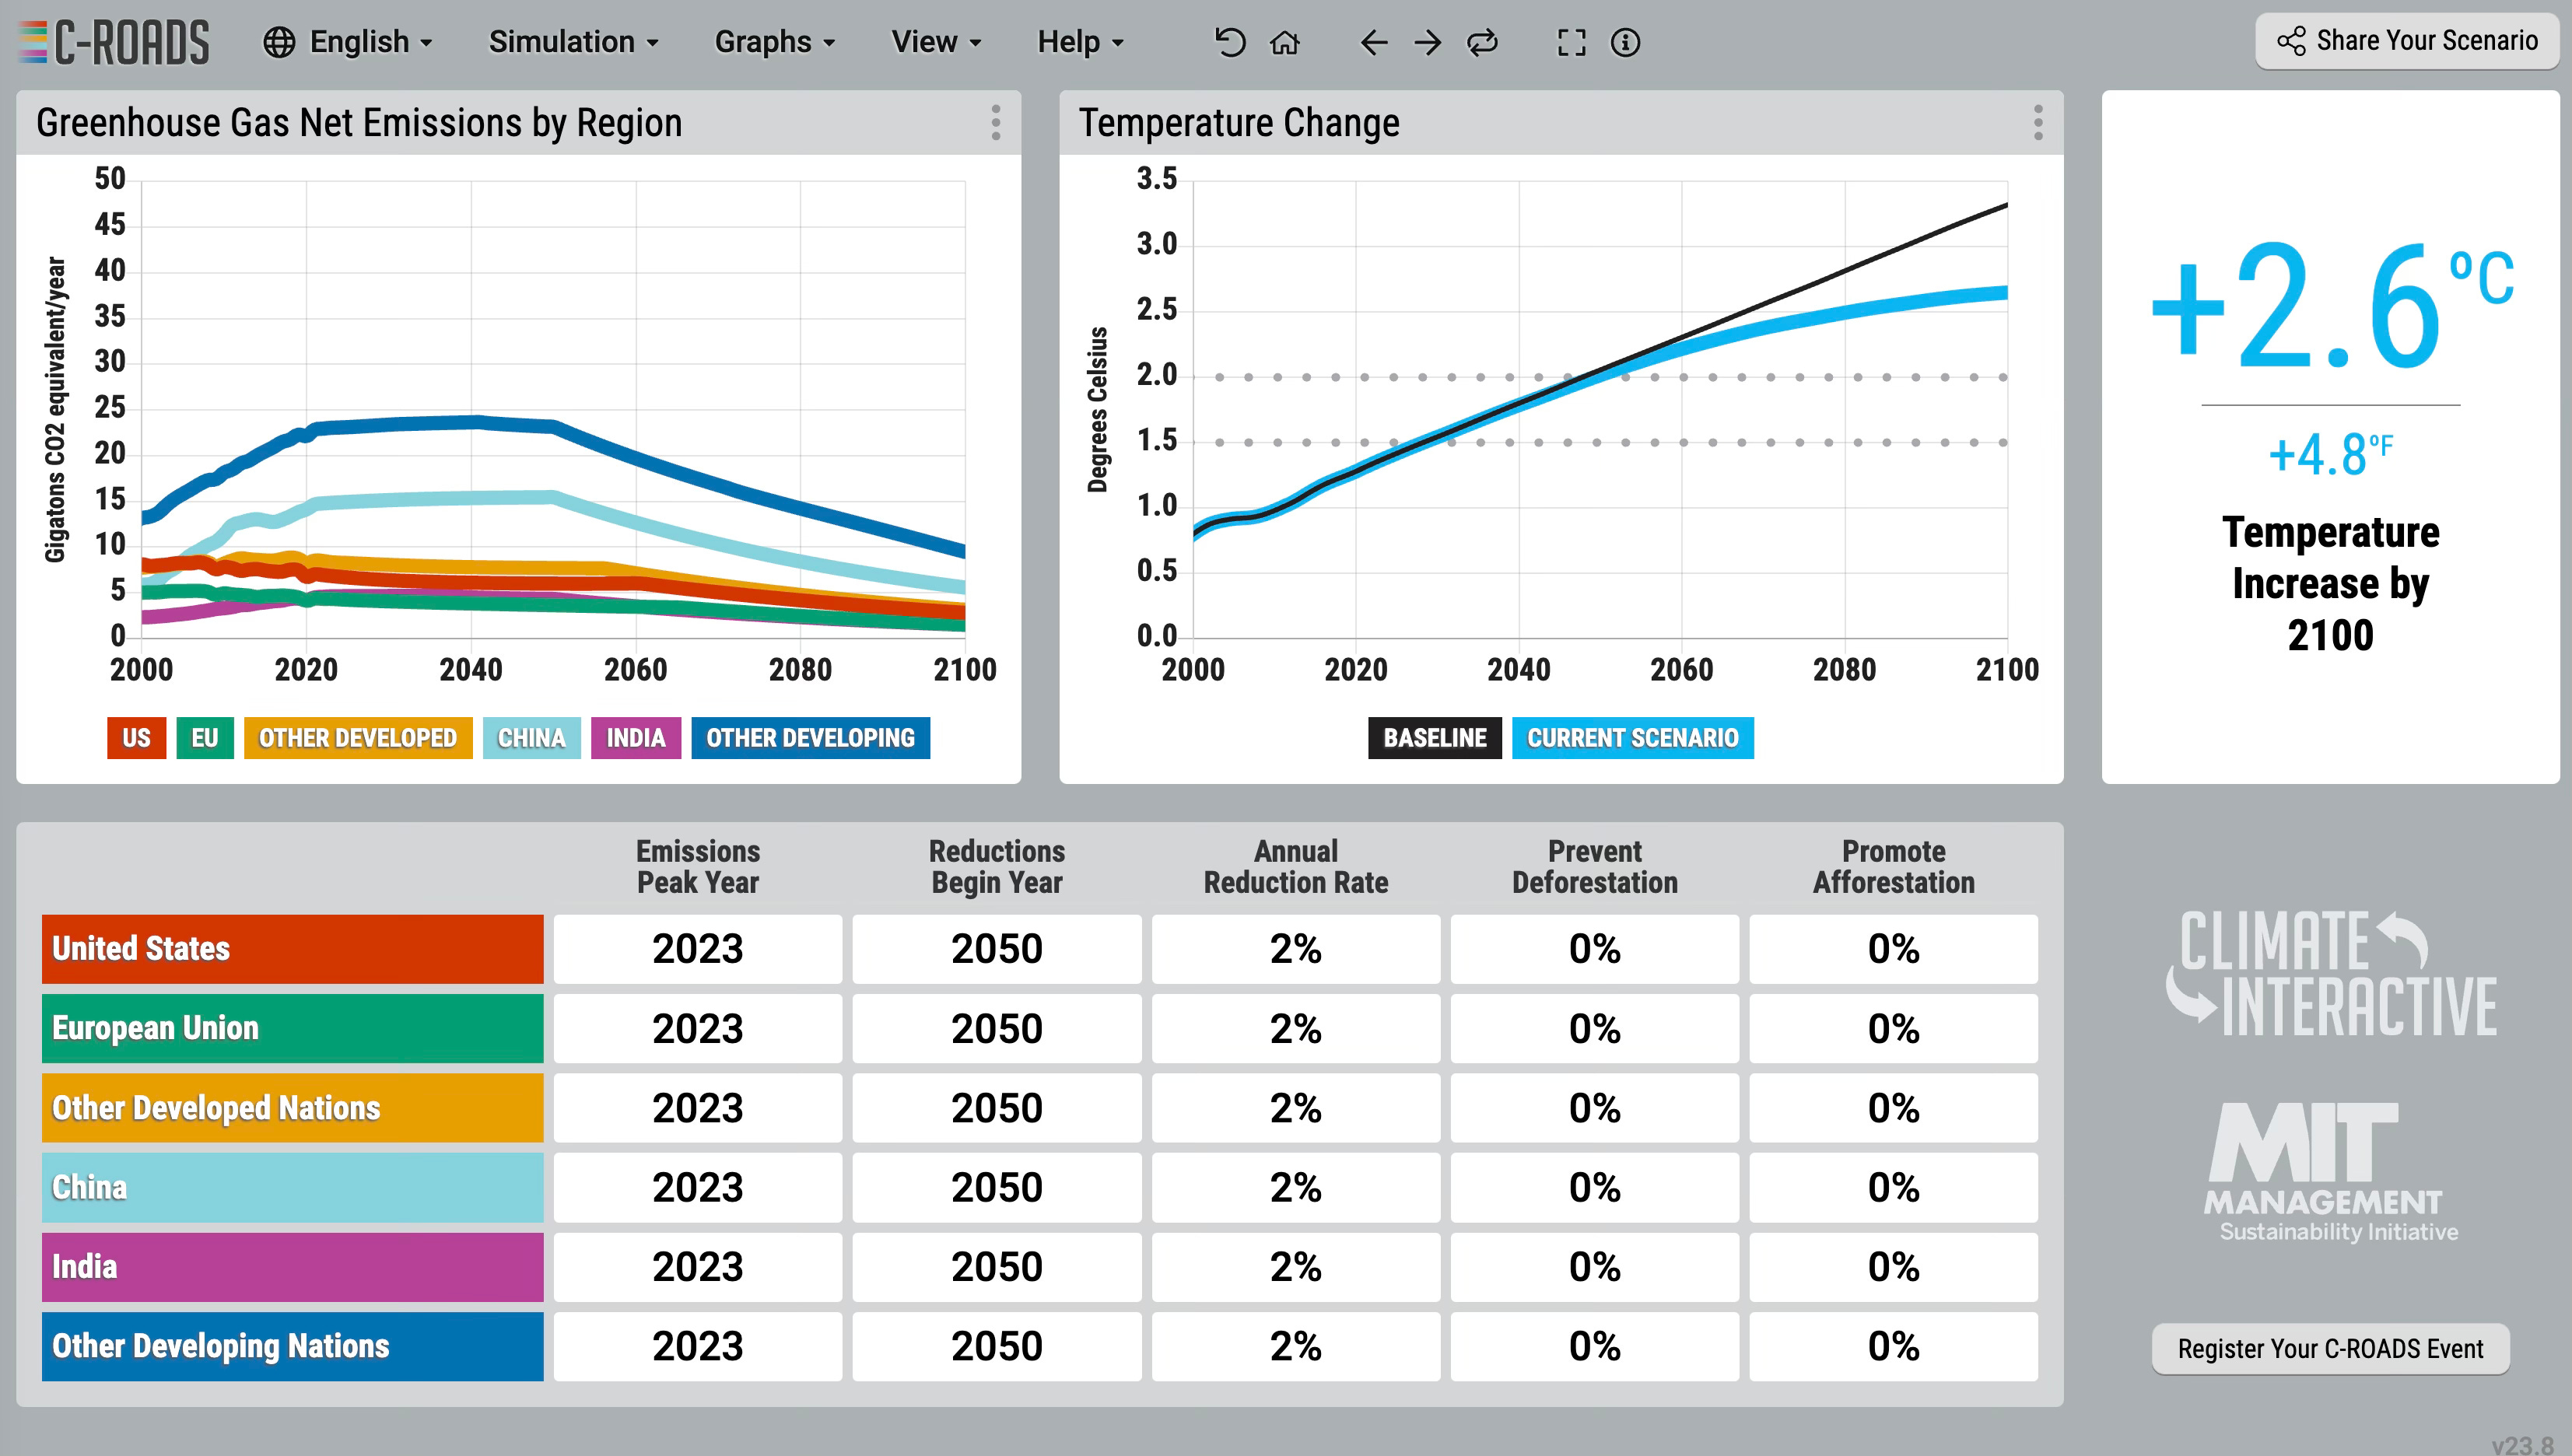
Scenario 2 - Bring the Reductions Earlier (2050) assume 2% reduction
Presumably 2050 is far away, and that’s the lesson here. If it take us til 2050 to get reductions we are still left with 2.6 temperature increase. This scenario is counter-intuitive if you think about it. And shows how even if we begin reductions in 2050, temperature will still climb, a bit jarring. Conclusion, 2% reductions aren’t enough.
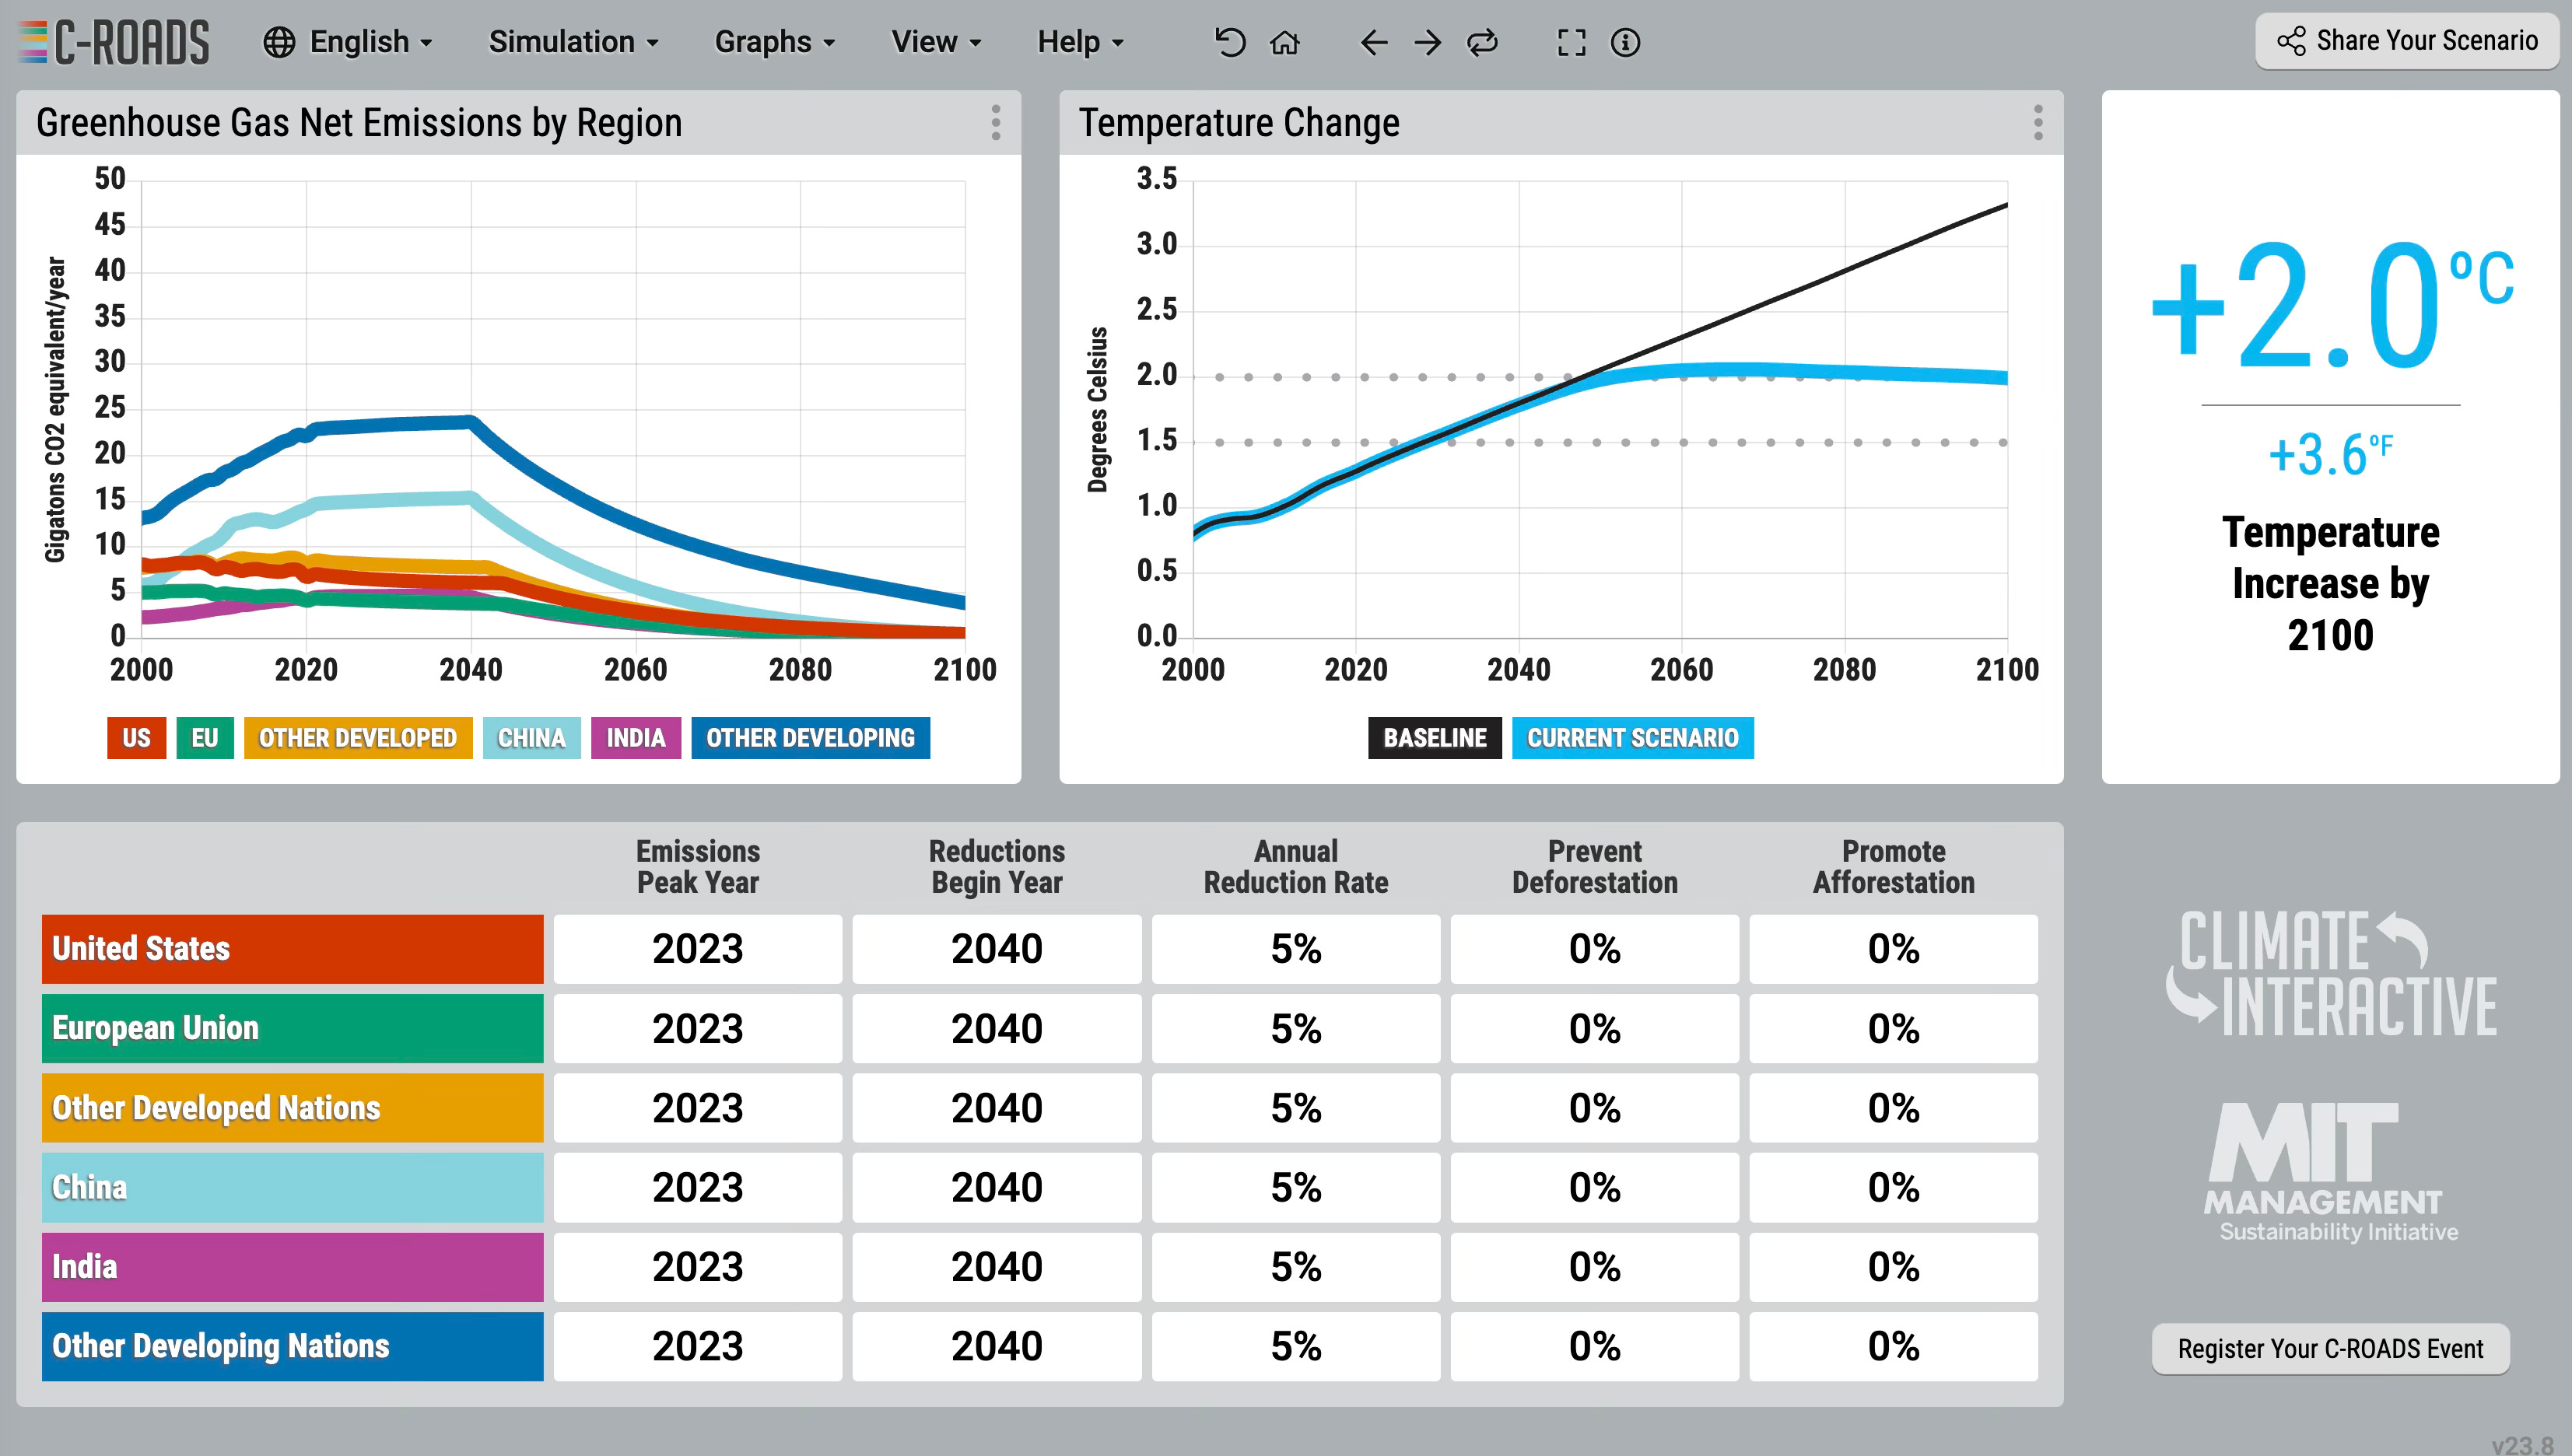
Scenario 3 - Bring the Reductions Earlier (2040) assume 5% reduction
This scenario finally gets us close to the targeted range of 1.5 to 2.0 degree rise in celsius. So success! Unfortunately look at the chart, you can visually see a 5% reduction per year would be huge, and let’s be honest not going to fall off a cliff like this. Also this is only 13 years away. So let’s keep 2040, but go back to the 2% Reduction
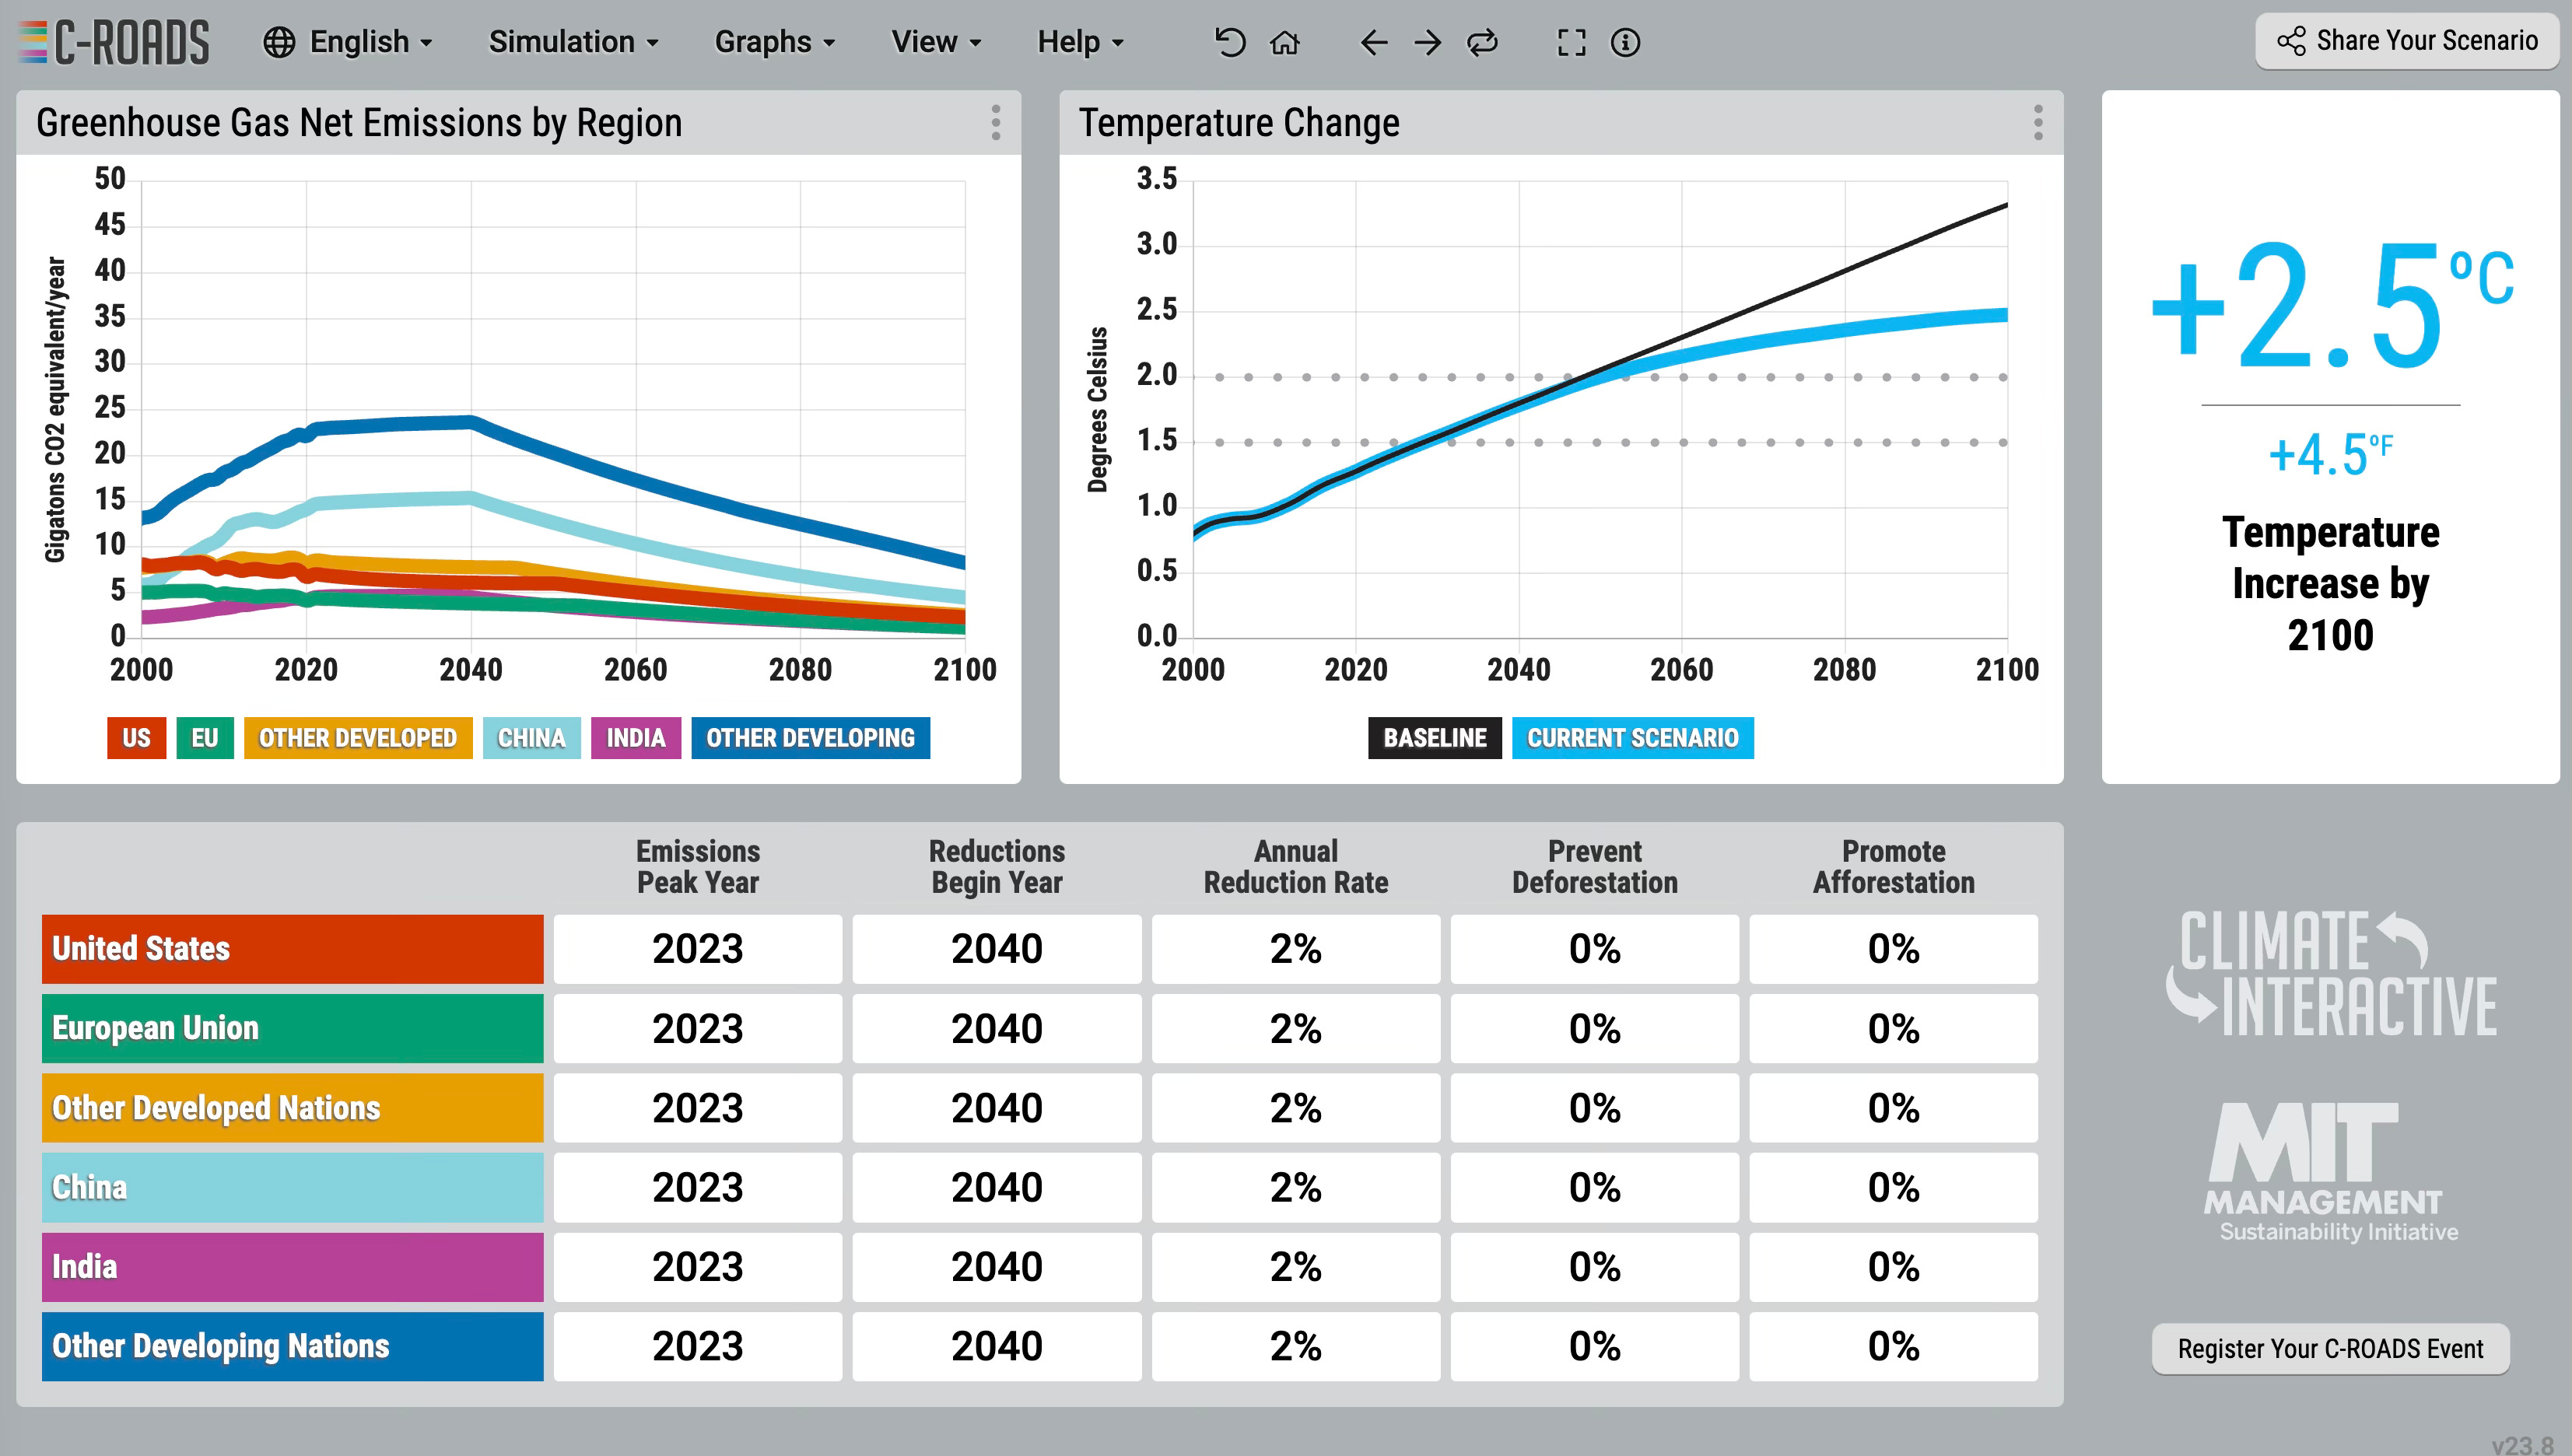
Scenario 3 - Bring the Reductions Earlier (2040) assume 2% reduction
Okay, this is of course difficult (2% reduction), but maybe reasonable (who am I to say). However we are still at 2.5 degrees.
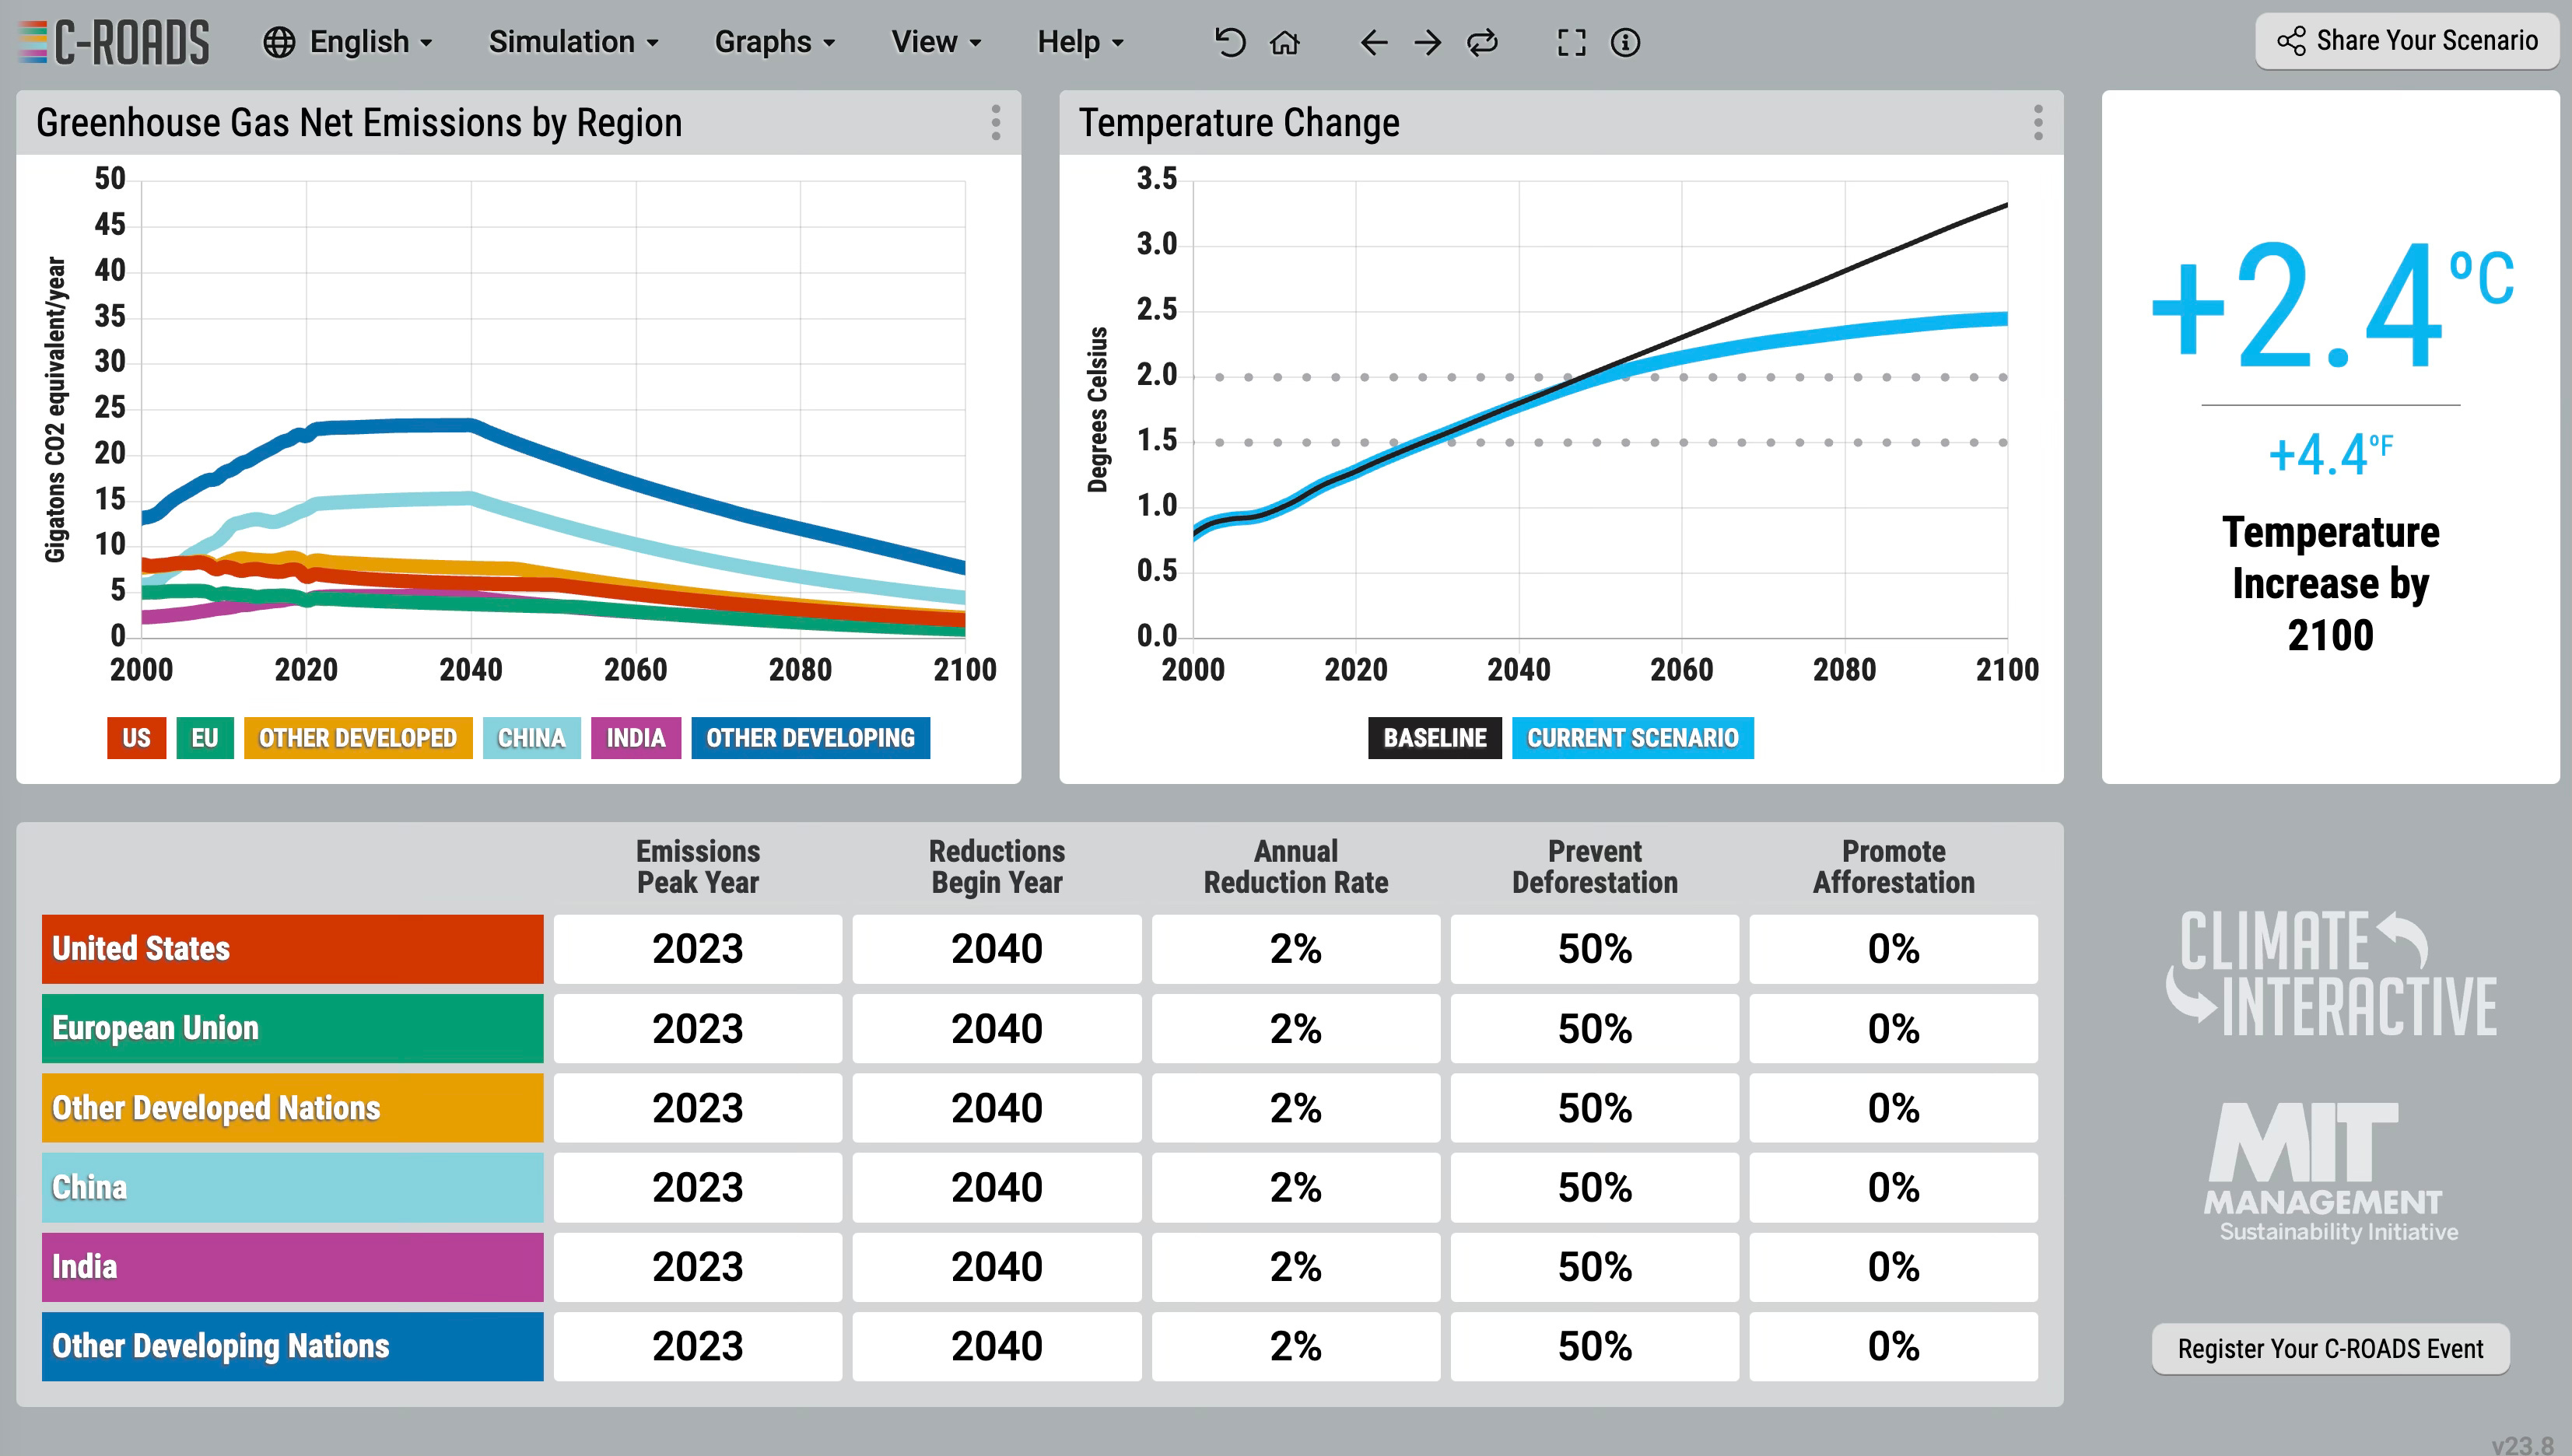
Scenario 4 - Prevent Deforrestation at 50%
Let’s play with preventing Deforrestation. Some effect. But not much
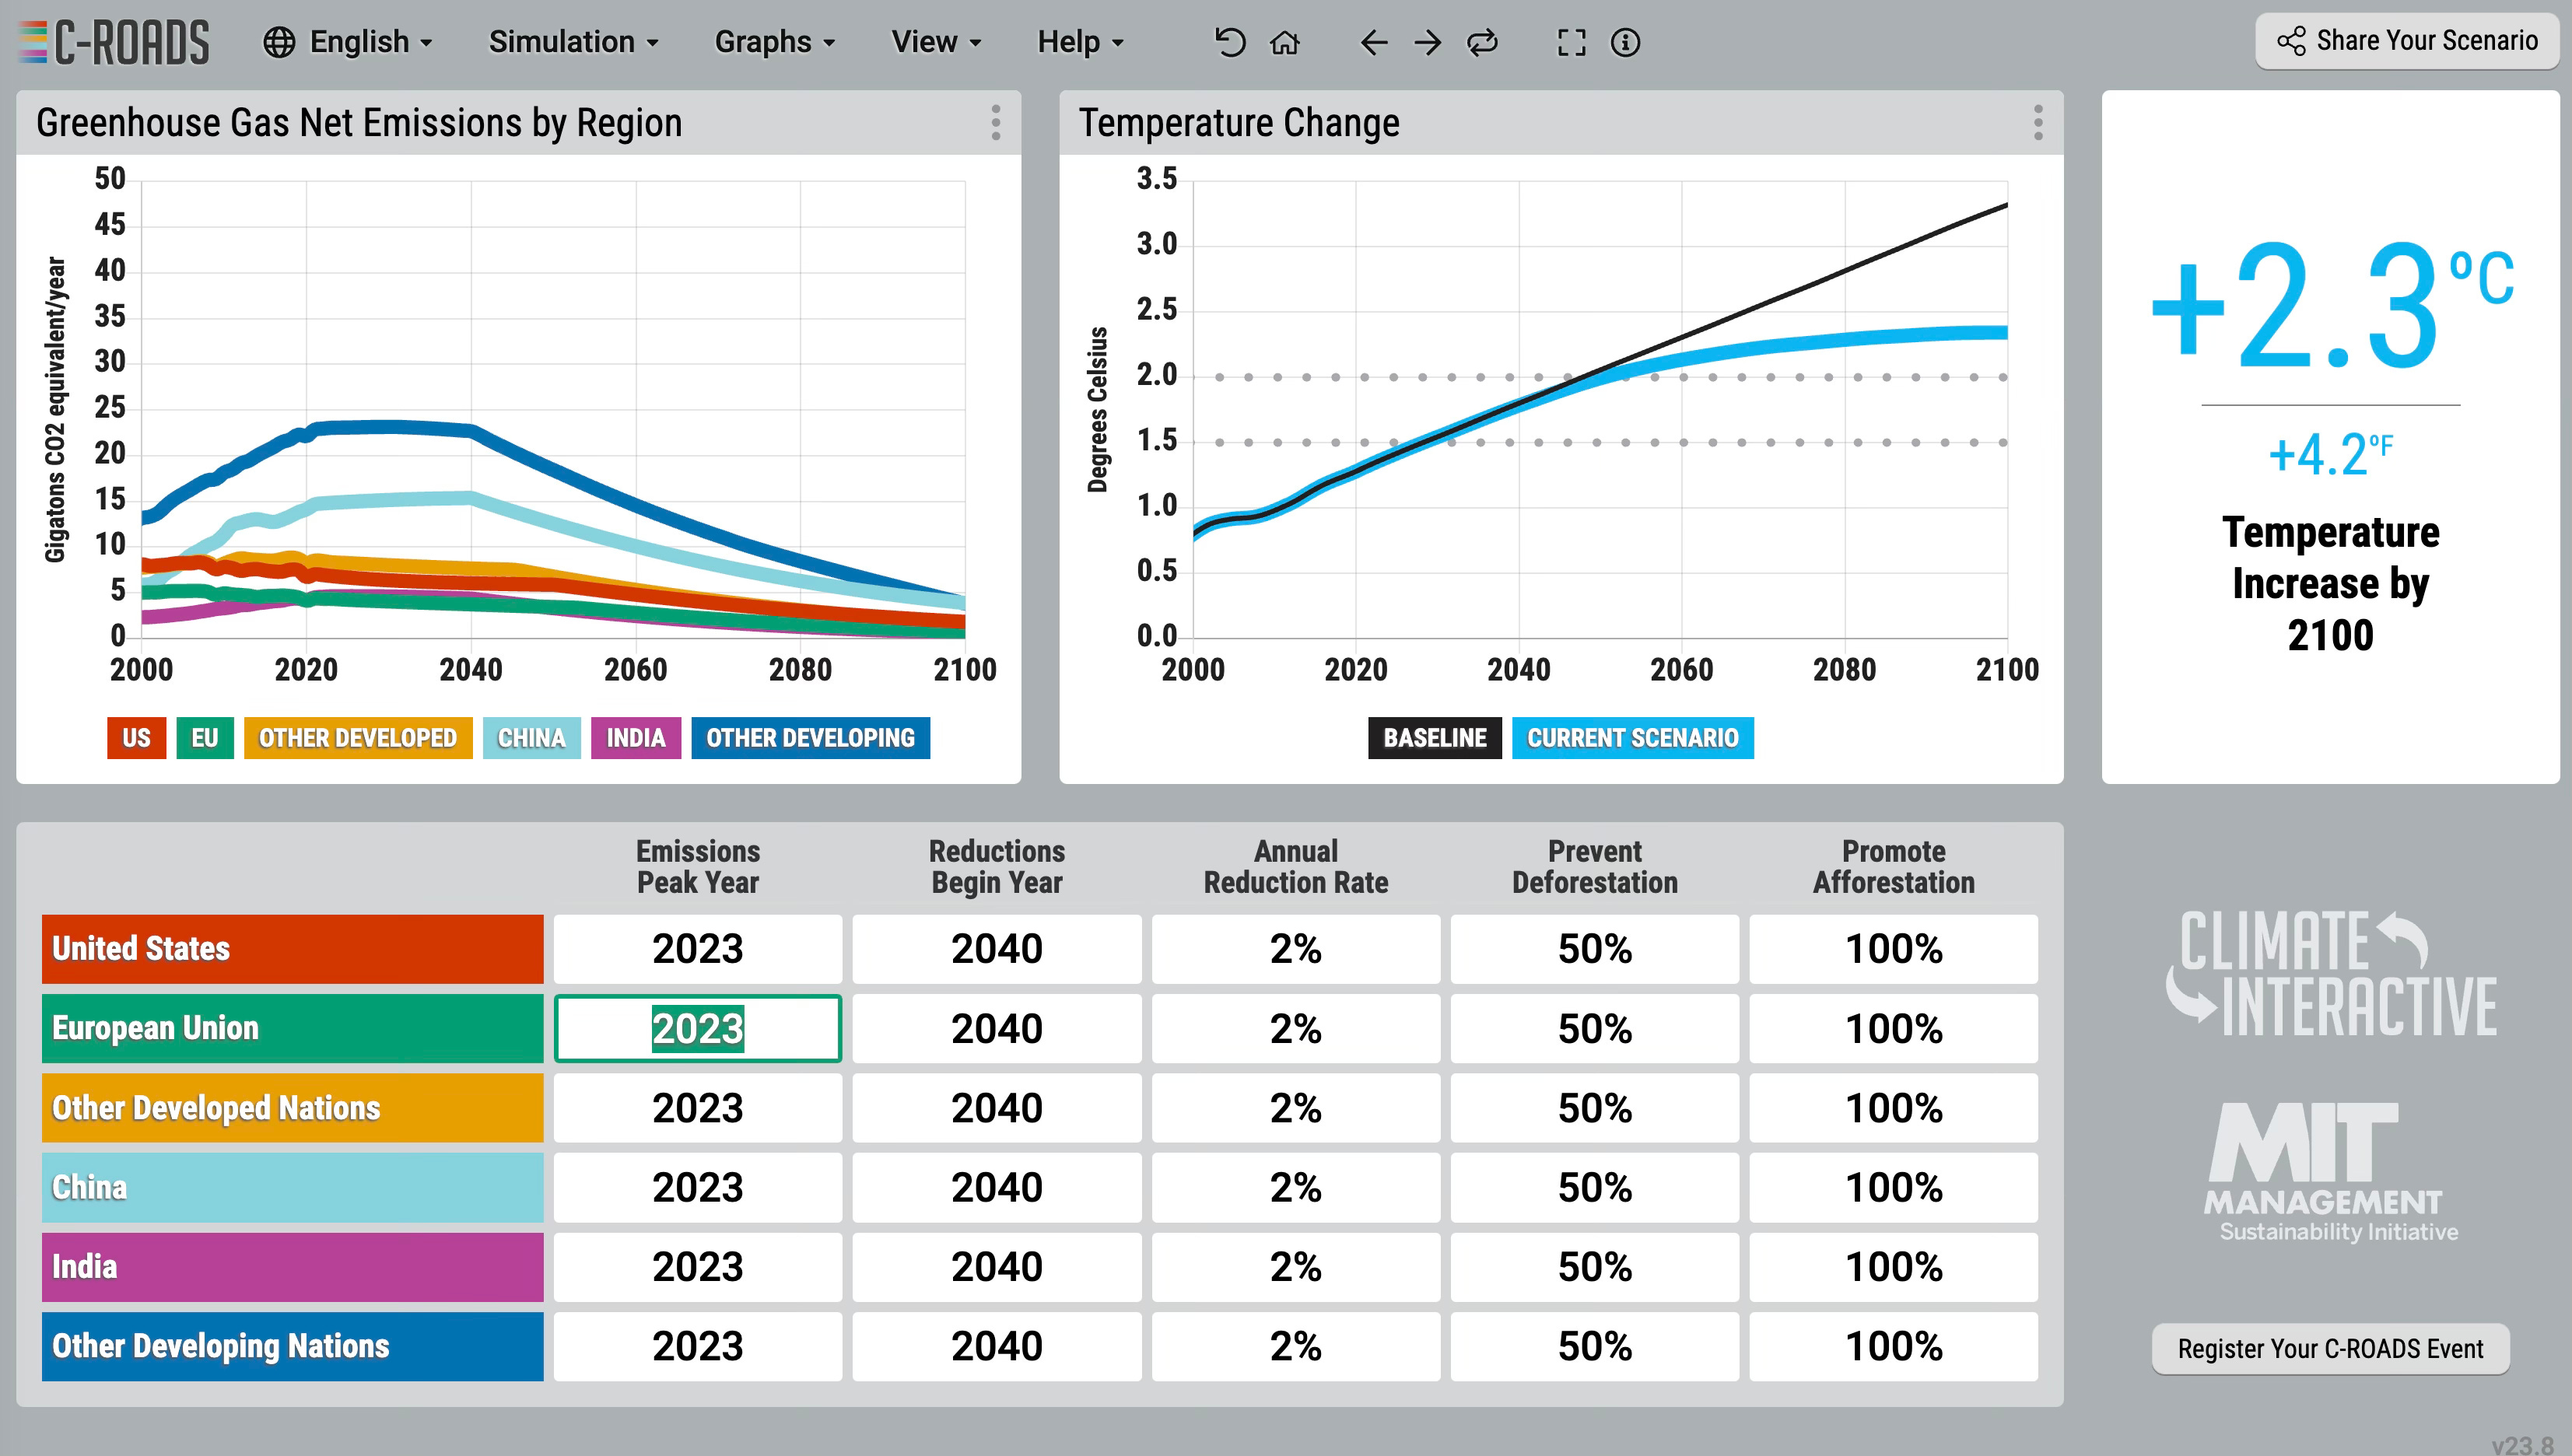
Scenario 5 - Add in significant reforestation at 100%
It helped a little, but still 2.3 degree! The model doesn’t got past 100%. So have to revert to the other levers.
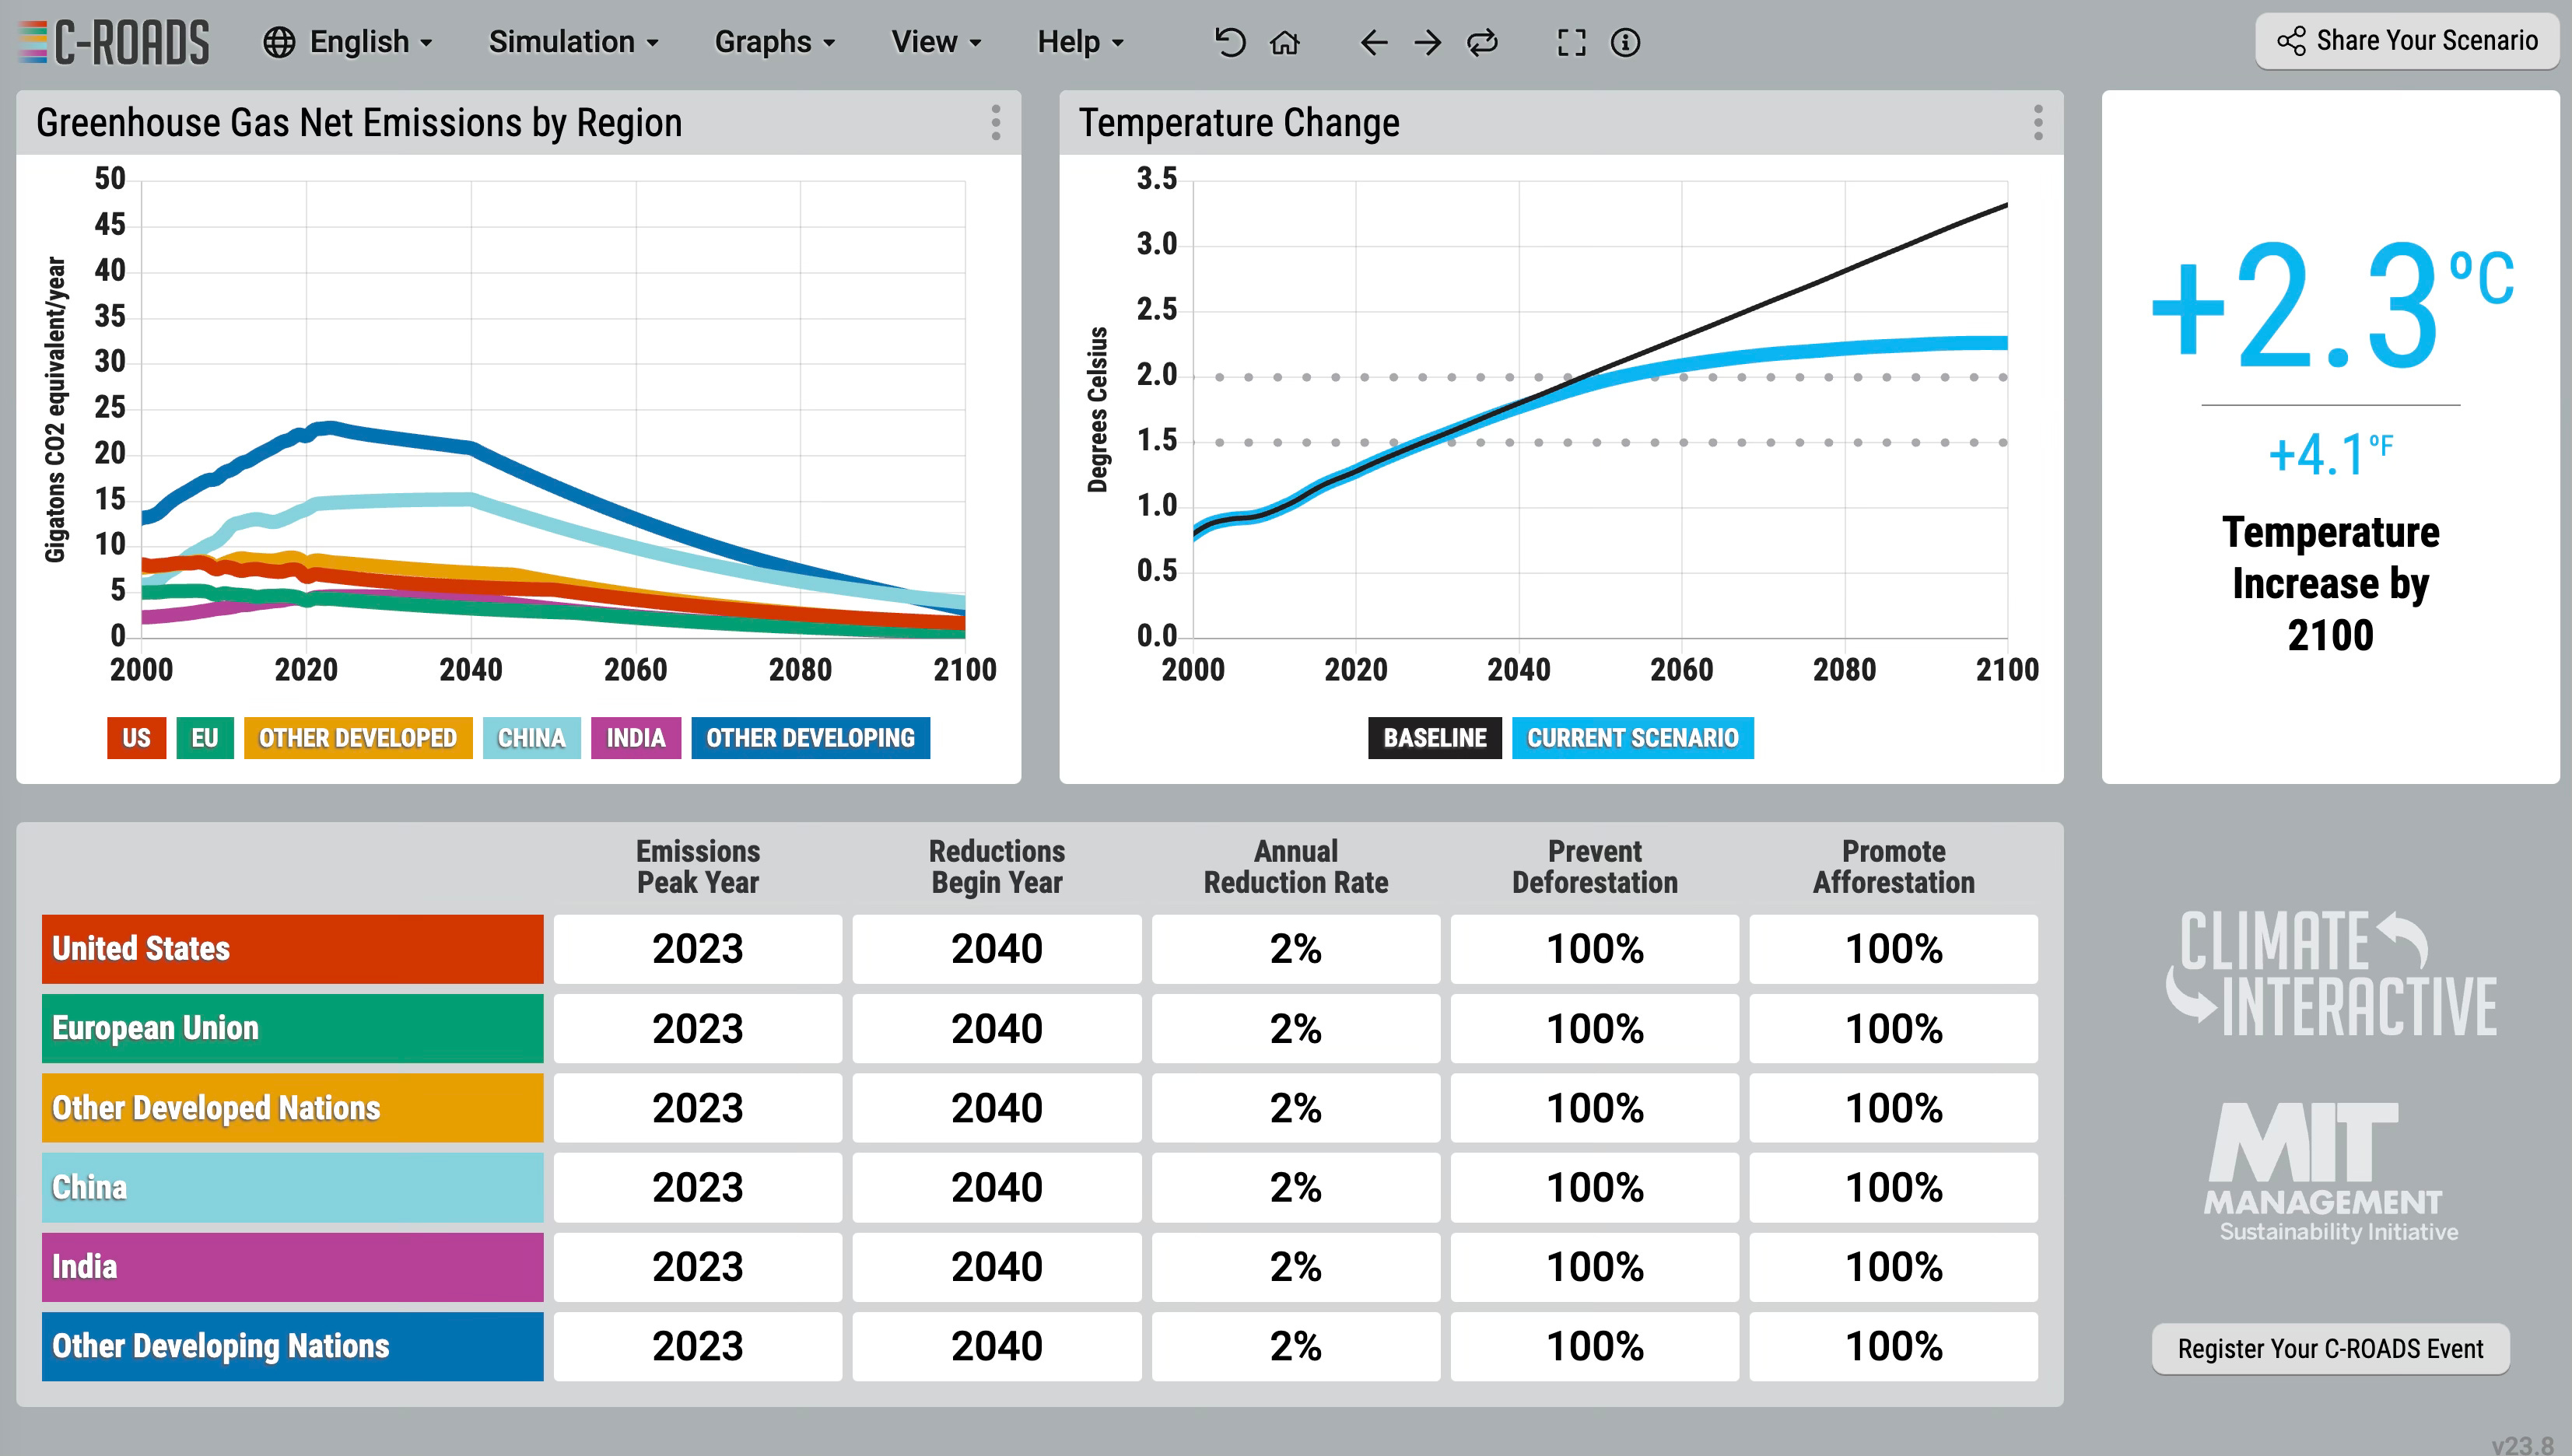
Scenario 6 - Add in significant reforestation at 100%
The final model. It still only get us to 2.3 degree.
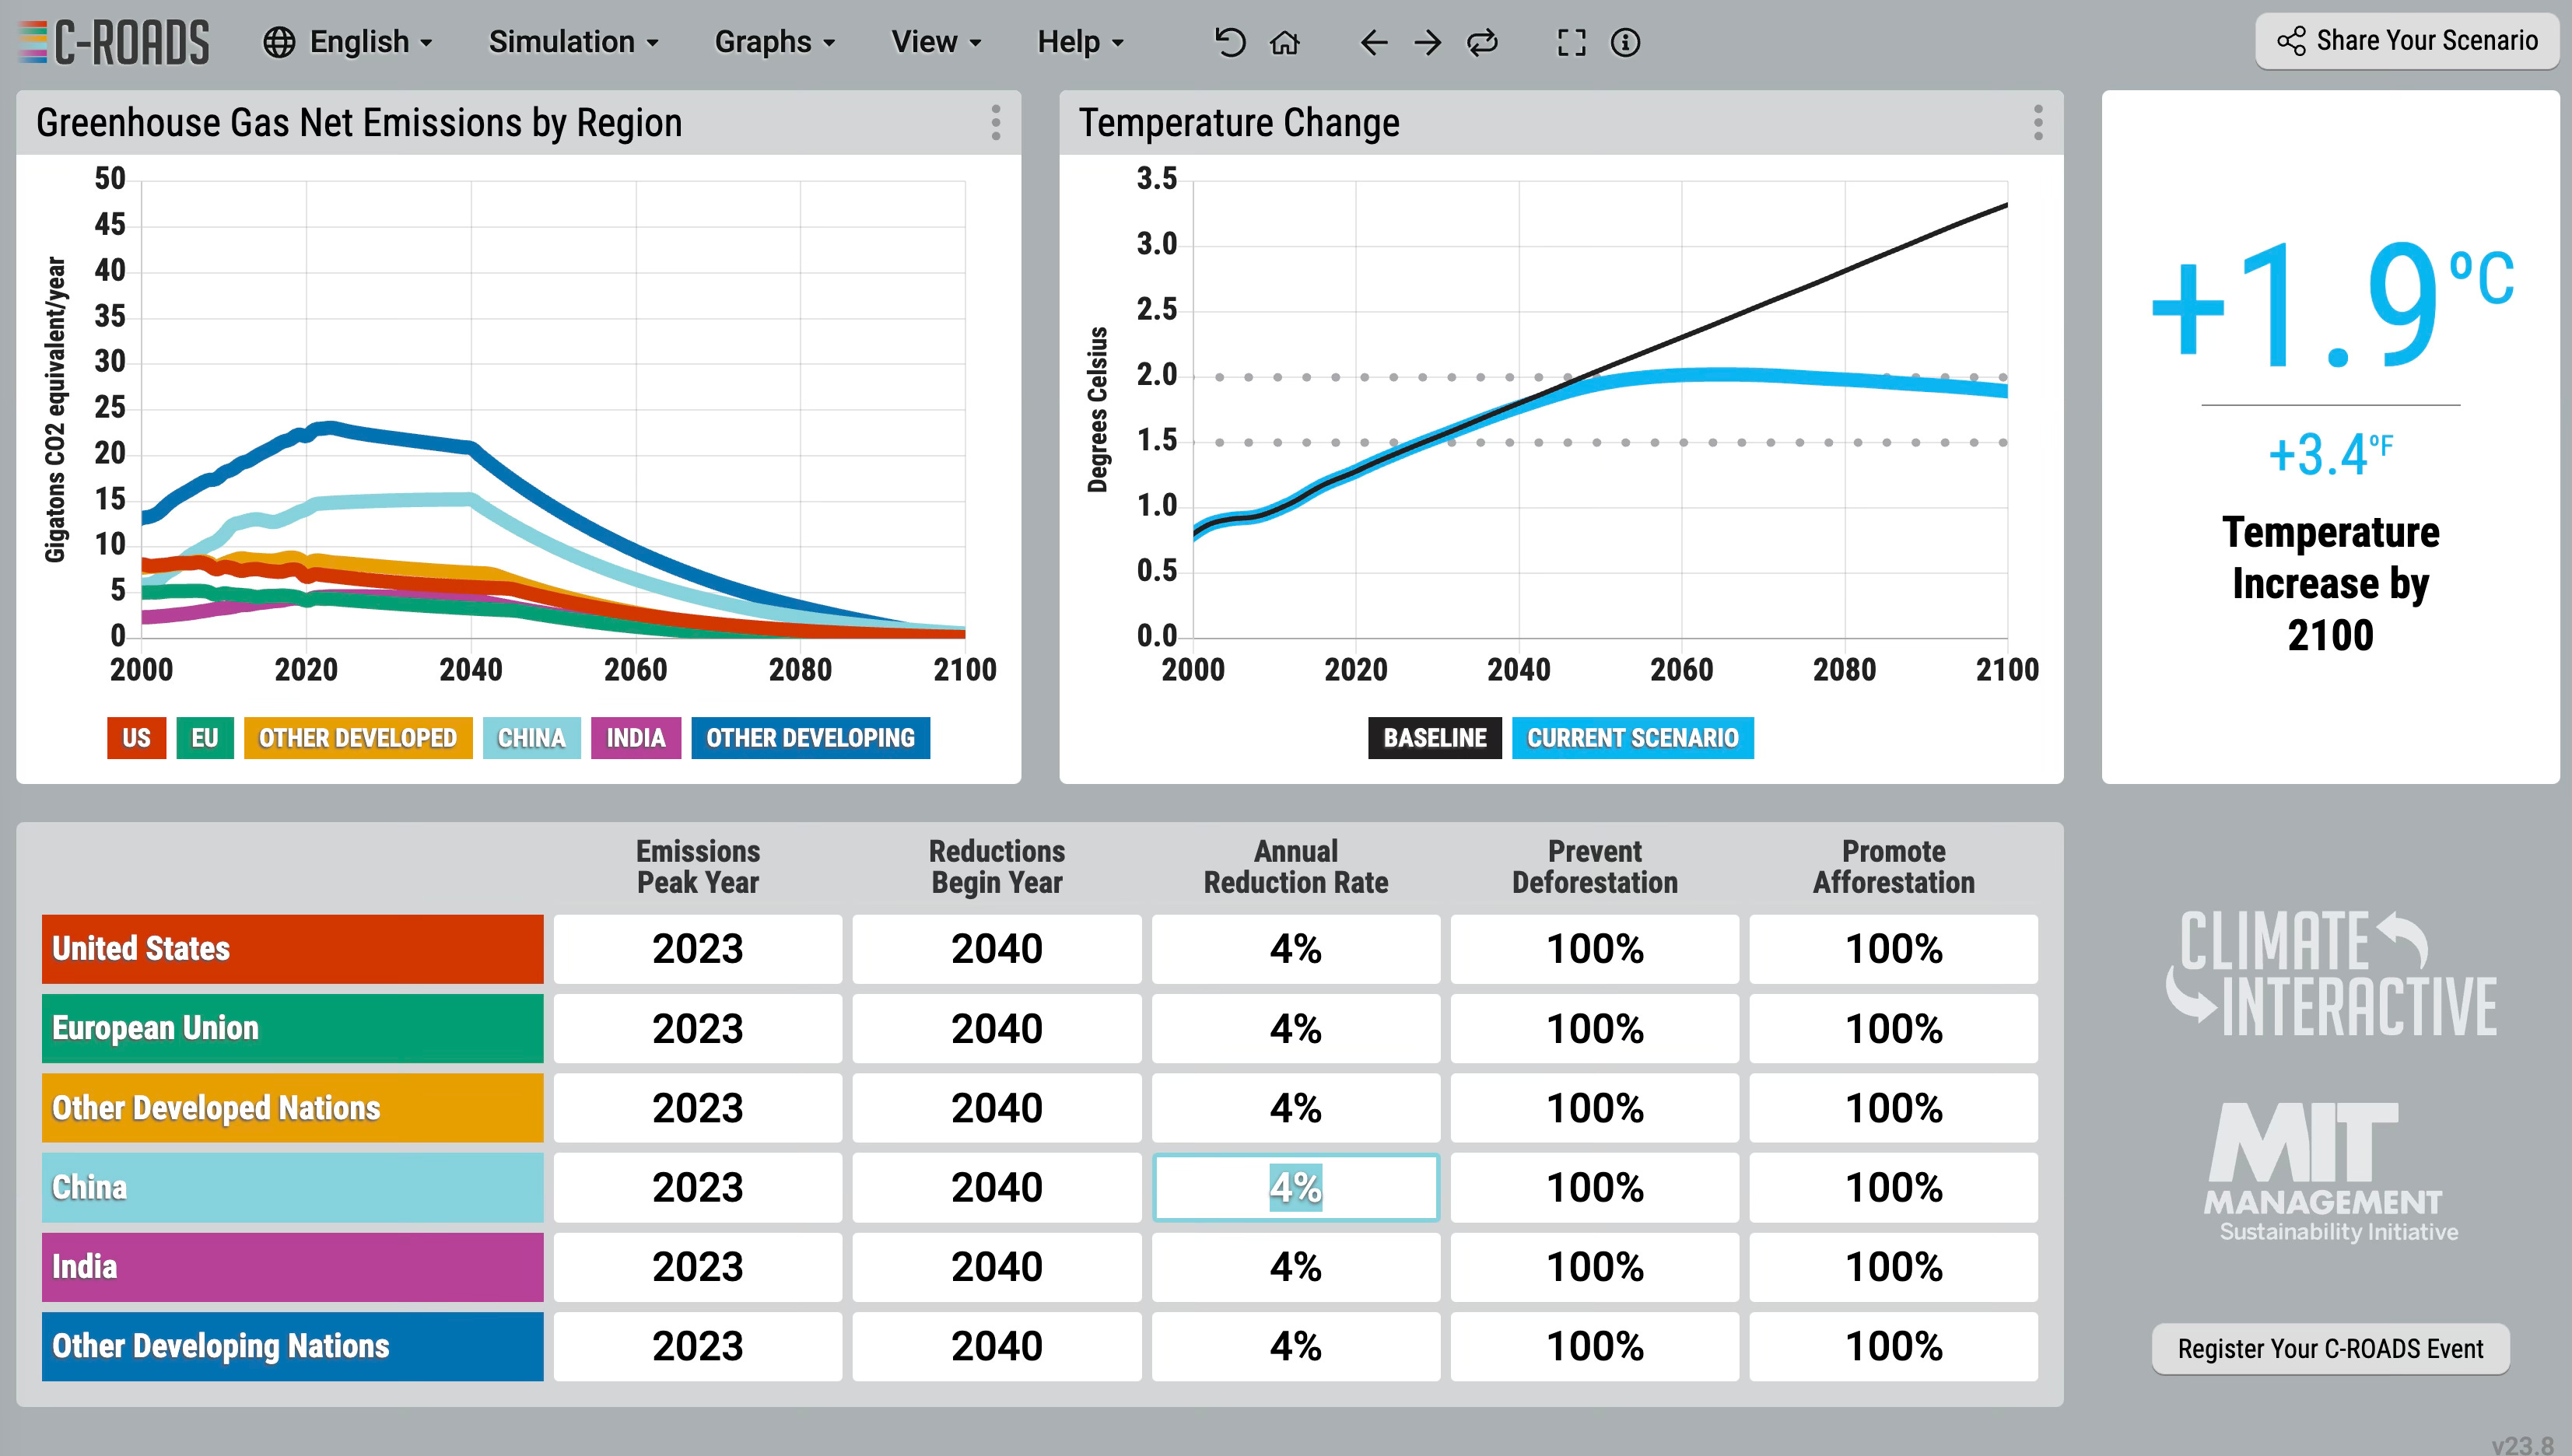
Scenario 7 - Increase the reduction to 4 %
Last scenario to illustrate the level of reduction needed.
Conclusion
I must say this model left me feeling a little overwhelmed. Of course we all hear about the difficulty to avert Climate Crisis, but these models seem to drive home the numbers that are needed. The model also make clear the “delays” and “buffers” that happen, which are counter intuitive. Reductions aren’t enough, but the timing and the other actions (like Reforestation and Foressation) matter too.
It’s clear that the challenges loom large. The assumptions of Reach Peak year in 2023. Start reducing in 2040 by 4% per year. Stop 100% of Deforestation, and promote 100% of Forrestation, are enough. But can society act to achieve this?